


SARS-CoV-2 variants of concern and variants under investigation in England
Technical briefing 10
7 May 2021
This briefing provides an update on previous briefings up to 1 April 2021
Summary
•There are 5 variants of concern and 8 variants under investigation (Table 1).
VUI-21APR-02 (B.1.617.2) was escalated to a variant of concern on 6 May 2021 (VOC21APR-02).
It is assessed as having at least equivalent transmissibility to B.1.1.7 based
on available data (moderate confidence). There are insufficient data currently to assess
the potential for immune escape. There has been a steep recent increase in the number
of cases identified (N=509 genomically confirmed) of this variant of concern in the UK,
which includes both imported (n=157 confirmed after travel) and domestically-acquired
cases. Postcodes of residence are most frequently identified as London and the North
West.
This technical briefing includes national overview data and surveillance updates for VUI21APR-01
(B.1.617.1), VOC-21APR-02 (B.1.617.2) and VUI-21APR-03 (B.1.617.3), and a
new clinical risk assessment for VOC-21APR-02 (B.1.617.2). The full update for each
individual variant will be published in the next technical briefing and monthly thereafter.
Published information on variants
The collection page gives content on variants, including prior technical briefings.
Definitions for variants of concern, variants under investigation and signals in monitoring
are detailed in technical briefing 8.
Variant status
Table 1 shows the current variants of concern and variants under investigation. Summary
epidemiology on each variant is shown in Table 4, case numbers are also updated online.
| Lineage | Designation | First detected in sequence from | Status |
| B.1.1.7 | VOC-20DEC01 | UK | VOC |
| B.1.351 | VOC-20DEC02 | South Africa | VOC |
| P1 | VOC-21JAN-02 | Japan ex Brazil | VOC |
| B1.1.7 with E484K | VOC-21FEB02 | UK | VOC |
| P2 | VUI-21JAN-01 | Brazil | VUI |
| A.23.1 with E484K | VUI-21FEB-01 | UK | VUI |
| B.1.525 | VUI-21FEB-03 | UK | VUI |
| B.1.1.318 | VUI-21FEB-04 | UK England | VUI |
| B.1.324.1 with E484K | VUI-21MAR-01 | UK | VUI |
| P3 | VUI-21MAR-02 | Philippines | VUI |
| B.1.617.1 with E484Q | VUI-21APR-01 | India | VUI |
| B.1.617.2 | VOC-21APR-02 | India | VOC |
| B.1.617.3 | VUI-21APR-03 | India | VUI |
| B.1.429 | California USA | Monitoring | |
| B.1.1.7 with S494P | UK | Monitoring | |
| A.27 | France (Mayotte) | Monitoring | |
| B.1.526 | New York USA | Monitoring | |
| B.1.1.7 with Q677H | UK | Monitoring | |
| B.1.620 | Imported cases to UK | Monitoring | |
| B1.214.2 | Belgium | Monitoring | |
| B.1.1.1 with L452Q and F490S | Imported cases to UK | Monitoring | |
| R.1 | Multiple locations | Monitoring | |
| B.1 with 214insQAS | International association | Monitoring | |
| C.36 | Multiple locations | Monitoring | |
| B.1.621 | International association | Monitoring | |
| B.1.617.3 | India | Monitoring |
New Variant of Concern VOC-21APR-02
Risk assessment
| Indicator | Risk assessment framework | |||
| Zoonotic emergence and transmission to humans | Animal reservoir identified but no evidence of transmission from animals to humans | Sporadic transmission from animals to humans | Frequent transmission from animals to humans | |
| Transmissibility between humans | No demonstrated person to person transmission | Limited human case clusters | Established human to human transmission, which appears similar to wild type virus | Transmissibility appears greater than the wild type virus |
| Infection severity | Evidence of less severe clinical picture or lower infection fatality than from wild type SARS-CoV-2 infections | Similar clinical picture and infection fatality to wild type SARSCoV-2 infections OR experimental animal data suggesting potential for increased disease severity humans | More severe clinical picture or higher infection fatality than from wild type SARSCoV-2 infections (limited to specific risk groups) | More severe clinical picture or higher infection fatality than from wild type SARSCoV-2 infections |
| Susceptibility and immunity – natural infection | Evidence of no antigenic difference from other circulating wild type virus and/or evidence of no increase in reinfection rate | Structural data suggesting antigenic difference from other circulating wild type virus | Experimental evidence of functional evasion of naturally acquired immunity | Evidence of frequent infection in humans with known prior infection with earlier virus variant. |
| Vaccines | Evidence of no structural or antigenic difference in vaccine targets and/or evidence that vaccine performance is preserved | Structural data suggesting difference in vaccine target epitopes | Experimental evidence of functional evasion of vaccine derived immunity | Evidence of frequent vaccine failure or decreased effectiveness in humans/td> |
| Drugs and therapeutics | Evidence of no structural or antigenic difference in therapeutic targets | Structural data suggesting difference in therapeutic target epitopes | Experimental evidence of reduced drug susceptibility | Evidence of frequent drug or therapeutic failure or decreased effectiveness in humans |
| Indicator | RAG* | Confidence | Assessment and rationale |
| Zoonotic emergence | There is no evidence that B.1.617.2 emerged from a zoonotic source. | ||
| Transmissibility between humans | MODERATE | Transmissibility appears greater than wildtype SARS-COV-2 B.1.617.2 is assessed as at least as transmissible as B.1.1.7 with moderate confidence. This is biologically plausible based on the mutation profile. This assessment is supported by evidence that it can compete with B.1.1.7 in the population and modelled growth estimates suggesting transmissibility at least equal to B.1.1.7. | |
| Infection severity | Insufficient information The majority of cases are very recent and there has been insufficient follow up time to allow an assessment of severity. | ||
| Susceptibility and immunity – natural infection | LOW | Experimental evidence of functional evasion of natural immunity There are laboratory data (primarily pseudovirus) supporting modest antigenic distance related to some individual mutations in this variant. The effect of the combination of mutations present is unknown. Reinfection data will be monitored through national surveillance. | |
| Vaccines | LOW | Experimental evidence of functional evasion of vaccine-derived immunity There are laboratory data (primarily pseudovirus) supporting modest antigenic distance related to some individual mutations in this variant. The effect of the combination of mutations present is unknown. National vaccine effectivenes | |
| Therapeutics | The therapeutics risk assessment is currently under review for all variants | ||
| Overall assessment | B.1.617.2 has spread rapidly in India based on available data. There have been multiple importations to the UK and onwards transmission within the UK. In some regions, S gene target data suggests that this variant may be more frequent than is indicated by the current sequence data, due to the lag in sequencing, and may have replaced B.1.1.7 to some extent. Modelled growth estimates suggest that the variant is at least as transmissible as B.1.1.7. Further analyses are required with targeted comparator groups and improved correction for importation to refine the position on transmissibility. Some early laboratory data suggest limited antigenic change. There are insufficient data as yet to assess reinfection or vaccine effectiveness through national surveillance. |
Case numbers, proportion, deaths and case fatality rate
The number of cases of variants of concern and variant under investigation are shown in
Table 4, including the proportion of variant cases compared to all sequenced cases,
deaths and case fatality rate.
| Variant | Case Number | Case Proportion | Deaths | Case Fatality |
| VOC-20DEC-01 | 196,341 | 4,009 | 2.0% | (2.0-2.1%) |
| VOC-20DEC-02 | 702* | 11 | 1.6% | (0.8-2.8%) |
| VOC-21FEB-02 | 43 | 1 | 2.3% | (0.1-12.3%) |
| VOC-21JAN-02 | 84** | 0 | 0.0% | (0.0-4.3%) |
| VUI-21FEB-01 | 79 | 2 | 2.5% | (0.3-8.8%) |
| VUI-21FEB-03 | 371 | 12 | 3.2% | (1.7-5.6%) |
| VUI-21FEB-04 | 162 | 1 | 0.6% | (0.0-3.4%) |
| VUI-21JAN-01 | 54 | 1 | 1.9% | (0.0-9.9%) |
| VUI-21MAR-01 | 2 | 0 | 0.0% | (0.0-84.2%) |
| VUI-21MAR-02 | 5 | 0 | 0.0% | (0.0-52.2%) |
| VUI-21APR-01 | 235 | 0 | 0.0% | (0.0-1.6%) |
| VOC-21APR-02 | 509*** | 0 | 0.0% | (0.0-0.7%) |
| VUI-21APR-03 | 9 | 0 | 0.0% | (0.0-33.6%) |
Excludes variant cases not linked to a known COVID-19 case. *Excludes 33 genomically provisional cases. **Excludes 6 genomically provisional cases. ***Excludes 168 genomically provisional cases aCase number England genomic cases 5 May 2021. bDeaths as of 5 May 2021 (within 28 days) with confirmed or probable VOC or total cases. c 95% Confidence Intervals calculated with Clopper–Pearson exact method, using R package PropCI
Cumulative cases in England of variants indexed by days since first reported, data as of 5 May 2021 (Find accessible data used in this graph in underlying data). Figure 1 demonstrates the rapid identification of B.1.617.2 cases over a short period.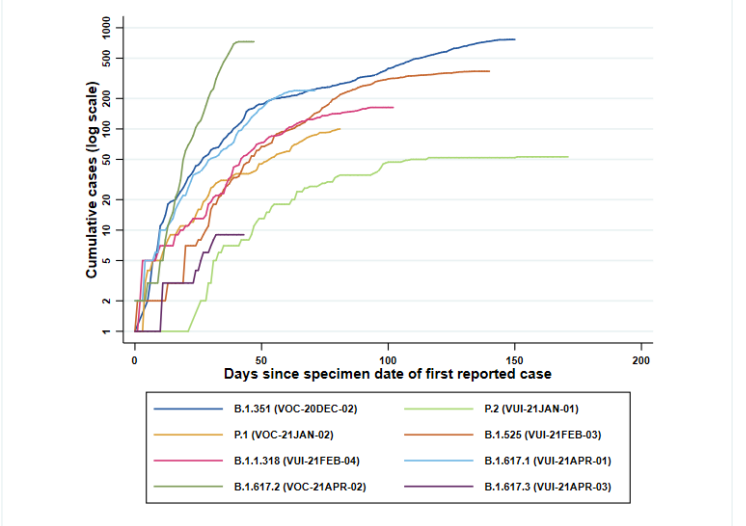
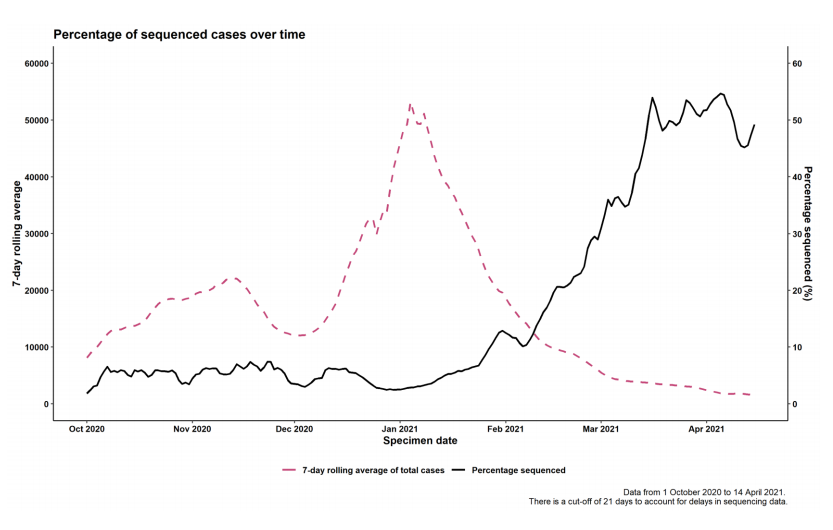
Figure 2. Coverage of sequencing: percentage of SARS-CoV-2 cases sequenced over time as of 5 May 2021. (Find accessible data used in this graph in underlying data).
Variant prevalence
The prevalence of different variants amongst all sequenced cases is presented in Figure 3, split by region in Figure 4 and by travel status in Figure 5. The ‘Other’ category in Figure 3 and Figure 4 includes genomes where the quality is insufficient to determine variant status and genomes that do not meet the current definition for any designated variant under investigation or variant of concern. The total genomic dataset used for this assessment includes enhanced testing and sequencing from individuals who have travelled, and surge testing and sequencing in outbreak areas. Prevalence of predicted antigenic change mutations over time is shown in Figure 6 and by travel status in Figure 7 and 8. The supplementary data for figures is available.
Figure 3. Variant prevalence for all England available case data from 1 February 2021 as of 4 May 2021 (VOC-20-DEC-01, B.1.1.7, not shown. Excluding cases where the specimen date was unknown) (Find accessible data used in this graph in underlying data)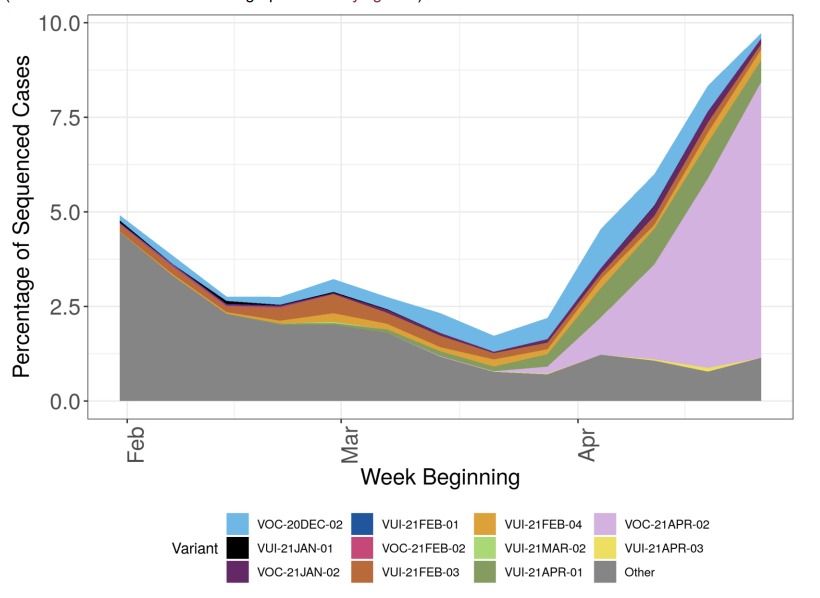
Figure 4. Variant prevalence for all England available case data from 1 February 2021 as of 4 May 2021 by region (VOC-20-DEC-01, B.1.1.7, not shown. Excluding cases where the region or specimen data were unknown). Black line indicates total number of cases sequenced (Find accessible data used in this graph in underlying data). The rapid rise in cases in the South West relates to only a small number of sequenced cases, predominantly related to travel or travel related clusters.
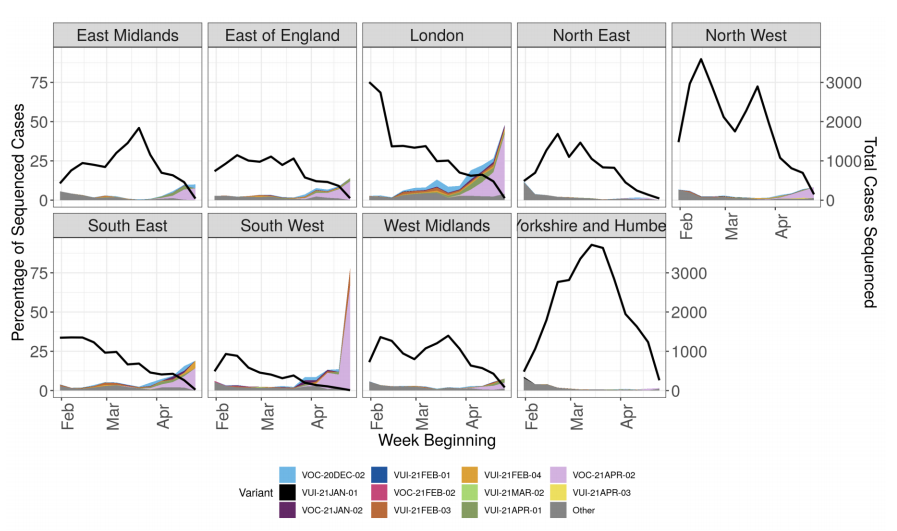
Figure 5. Prevalence of variants over time: all sequenced cases in England, split by travel status (VOC-20-DEC-01, B.1.1.7, not shown) (Find. accessible data used in this graph in underlying data). Travel status includes cases matched to Passenger Locator Form data and samples taken as part of the managed quarantine service or through private testing following travel. The total number of sequenced cases in each week is shown in the bars below, split by travel status.
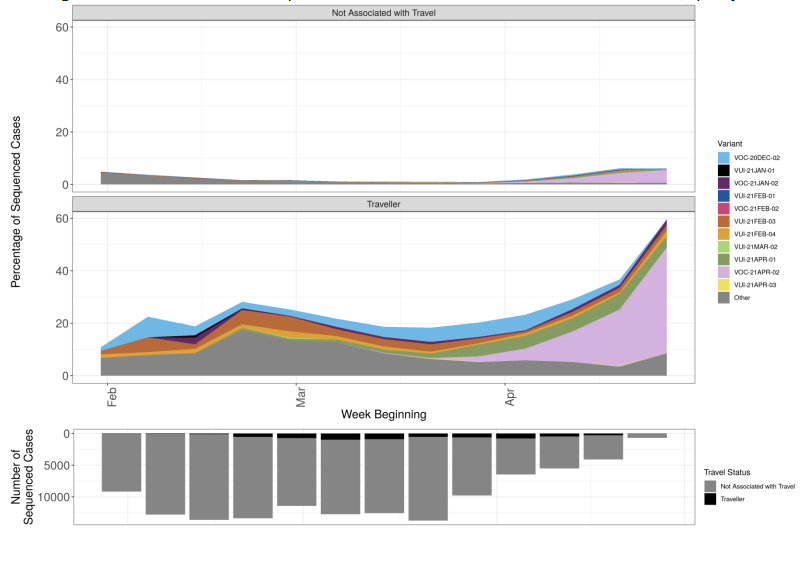
Figure 6. Prevalence of predicted antigenic change mutations over time: all cases in England(Find. accessible data used in this graph in underlying data). Mutations potentially associated with antigenic change are monitored as part of horizon scanning. Figure 6 shows the proportion of these mutations over time in the all England genomic dataset, illustrating the increase in L452R. The most commonly occurring mutations are detailed in the figure. Where a sequence has more than 1 mutation it will be displayed twice in the plot. Black line indicates the total sequenced cases. The supplementary data for figures is available.
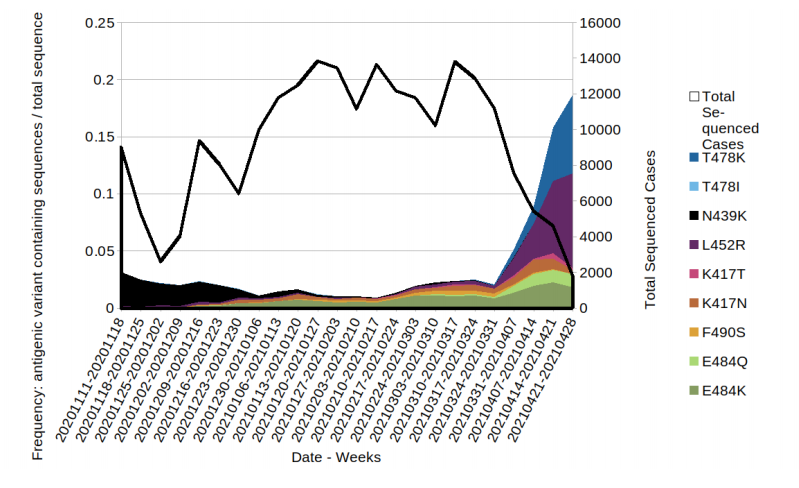
Figure 7. Prevalence of predicted antigenic change mutations over time: all cases in England that have travelled prior to test/sequence result. (Find. accessible data used in this graph in underlying data). The most commonly occurring mutations are detailed in the figure. Where a sequence has more than 1 mutation it will be displayed twice in the plot. Black line indicates the total sequenced cases.
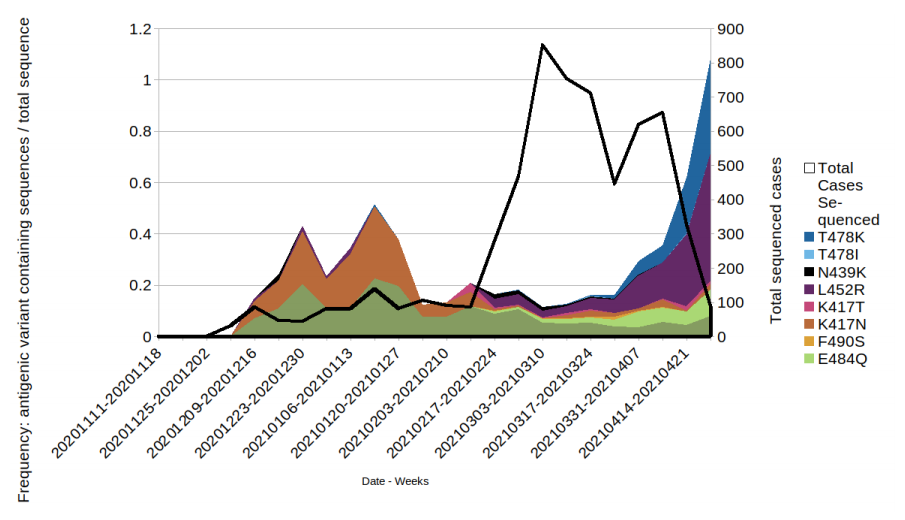
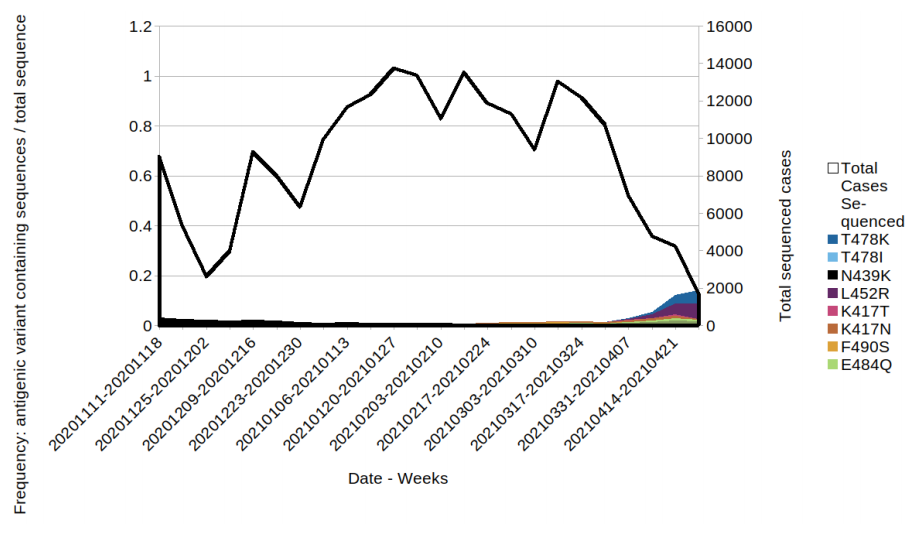
Figure 8. Prevalence of predicted antigenic change mutations over time: all cases in England that have not travelled prior to test or sequence result. (Find. accessible data used in this graph in underlying data). The most commonly occurring mutations are detailed in the figure. Where a sequence has more than 1 mutation it will be displayed twice in the plot. Black line indicates the total sequenced cases.
Variants in lineage B.1.617
A variant first detected in India was designated under investigation on 1 April 2021 as
VUI-21APR-01 (B.1.617.1). VOC-21APR-02 (B.1.617.2) was designated as variant of
concern on 6 May 2021. VUI-21APR-03 (B.1.617.3) was designated variant under
investigation on 27 April 2021. A repository containing the up-to-date genomic
definitions for all VOC and VUI as curated by Public Health England was created 5
March 2021. The repository can be accessed on GitHub.
Genomic Profile for VOC-21APR-02 (B.1.617.2) and VUI-21APR03
(B.1.617.3)
| VOC-21APR-02 | T19R, 156-158del, L452R, T478K, D614G, P681R, D950N |
| VUI-21APR-03 | T19R, 156-158del, L452R, E484Q, D614G, P681R, D950N |
VUI-21APR-01 (B.1.617.1)
| Region | Case Number | Case Proportion | Cases that have travelled | Proportion of travellers among cases |
| East Midlands | 31 | 13.2% | 16 | 51.6% |
| East of England | 19 | 8.1% | 15 | 78.9% |
| London | 109 | 46.4% | 57 | 52.3% |
| North East | 4 | 1.7% | 2 | 50% |
| North West | 22 | 9.4% | 11 | 50% |
| South East | 23 | 9.8% | 14 | 60.9% |
| South West | 3 | 1.3% | 3 | 100% |
| West Midlands | 11 | 4.7% | 4 | 36.4% |
| Yorkshire and Humber | 13 | 5.5% | 9 | 69.2% |
Figure 9. Confirmed and probable VUI-21APR-01 (B.1.617.1) cases by specimen date as of 5 May 2021 Larger plot includes last 60 days only. (Find accessible data used in this graph in underlying data).
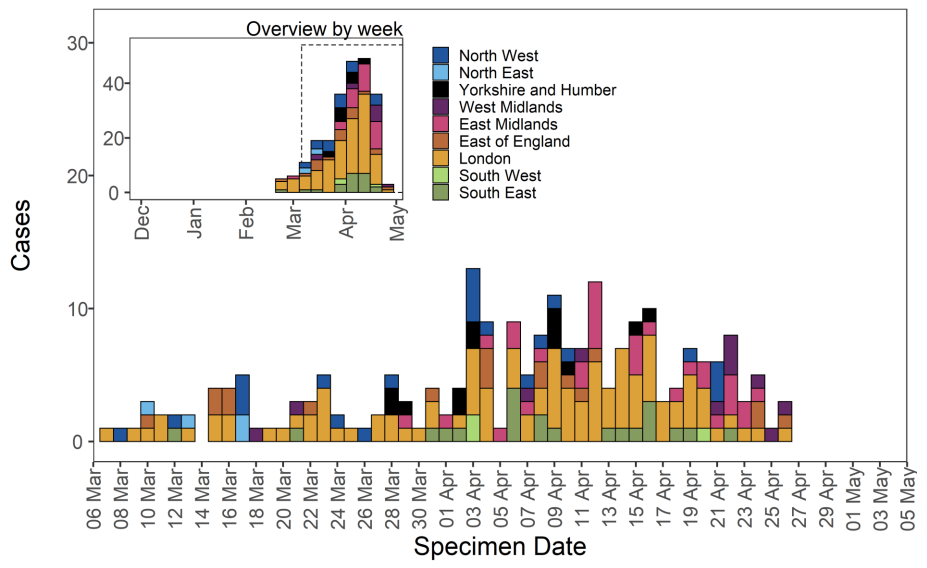
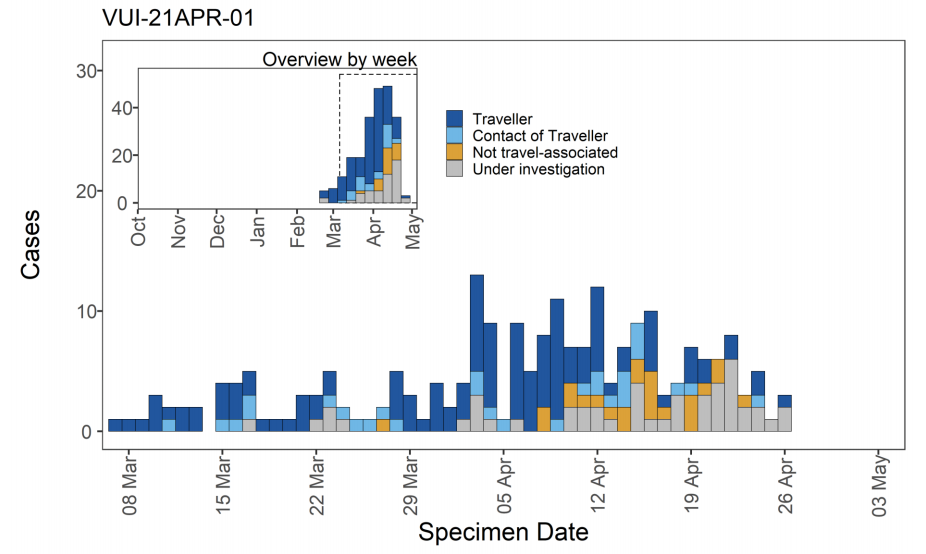
Figure 10. Travel data for confirmed and probable VUI-21APR-01 (B.1.617.1) cases by specimen date as of 5 May 2021 Larger plot includes last 60 days only. (Find accessible data used in this graph in underlying data). N/A indicates information is pending or not available.
VOC-21APR-02 (B.1.617.2)
| Region | Case Number | Case Proportion | Cases that have travelled | Proportion of travellers among cases |
| East,Midlands | 49 | 9.6% | 17 | 34.7% |
| East,of,England | 56 | 11.0% | 26 | 46.4% |
| London | 191 | 37.5% | 41 | 21.5% |
| North,East | 3 | 0.6% | 1 | 33.3% |
| North,West | 87 | 17.1% | 14 | 16.1% |
| South,East | 53 | 10.4% | 24 | 45.3% |
| South,West | 25 | 4.9% | 13 | 52% |
| West,Midlands | 26 | 5.1% | 12 | 46.2% |
| Yorkshire,and,Humber | 19 | 3.7% | 9 | 47.4% |
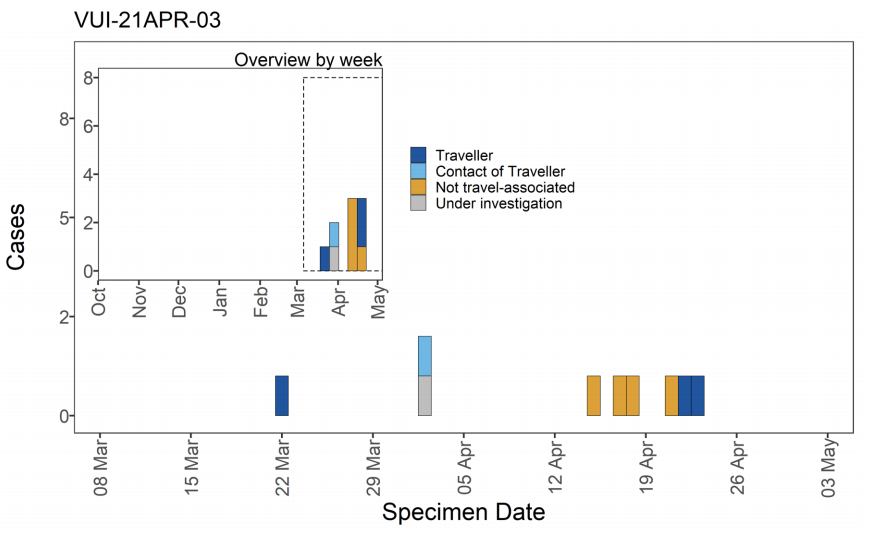
Figure 14. Travel data for confirmed and probable VUI-21APR-03 (B.1.617.3) cases by specimen date as of 5 May 2021 Larger plot includes last 60 days only. (Find accessible data used in this graph in underlying data). N/A indicates information is pending or not available.
Trends in S gene detection
The S-gene target in a specific three-target assay used in some Lighthouse Laboratories
fails in B.1.1.7, previously predominant, but is detected in VUI-21APR-01, VOC-21APR-02
and VUI-21APR-03 variants as well as VOC-20DEC02 (B.1.351) and some others. Figure
13 shows the number of sequenced S gene positive isolates over time since 1 January
2021 (data as of 3 May 2021), as well as the distribution of identified variants among these
specimens. Unclassified variants refer to those not considered a VOC or VUI; these
dominated the sequenced S gene positive specimens at the beginning of 2021, and
decreased in proportion towards the end of April 2021 (Figure 15).
Among 354 sequenced S gene positive samples in the second half of April 2021
(specimen dates up to 26 March 2021 due to reporting lag), 95% (n = 337) were variants
under investigation or of concern, and 67.2% were VOC-21APR-02. The number of
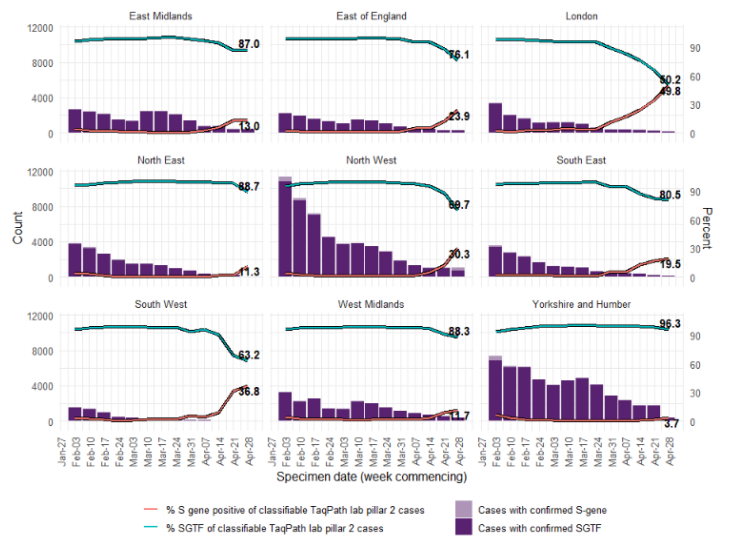
sequenced S gene positive samples (Figure 15) as well as the number and proportion of S
gene positive samples nationally (Figure 16) has increased in recent weeks, particularly in
London (Figure 17), with data suggesting this growth is driven by the increase in variant
cases. Targeted sequencing, for instance of contacts of variant cases, may however result
in overrepresentation of variant cases.
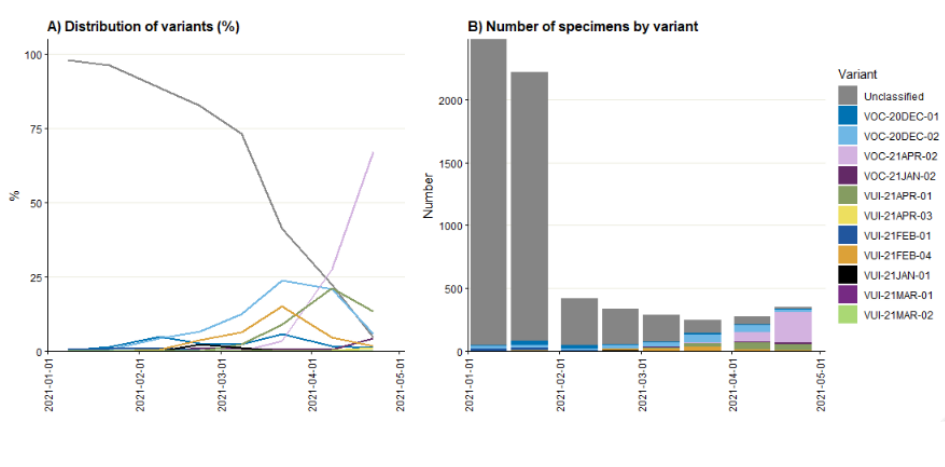
Figure 16. Weekly number and proportion of England Pillar 2 COVID-19 cases with detectable S gene or SGTF among those tested with the TaqPath assay and with S gene detection results (3 February 2021 to 4 May 2021) Confirmed SGTF:Non-detectable S gene and <=30 Ct values for N and ORF 1ab genes. Confirmed S gene: <=20 Ct values for S,N and ORF 1ab genes. TaqPath labs: Alderly Park, Milton Keynes, and Glasgow Lighthouse Labs which use TaqPath COVID-19 RTPCR. Data source: SGSS. Cases deduplicated to one positive test per person per week, prioritising SGTF tests.
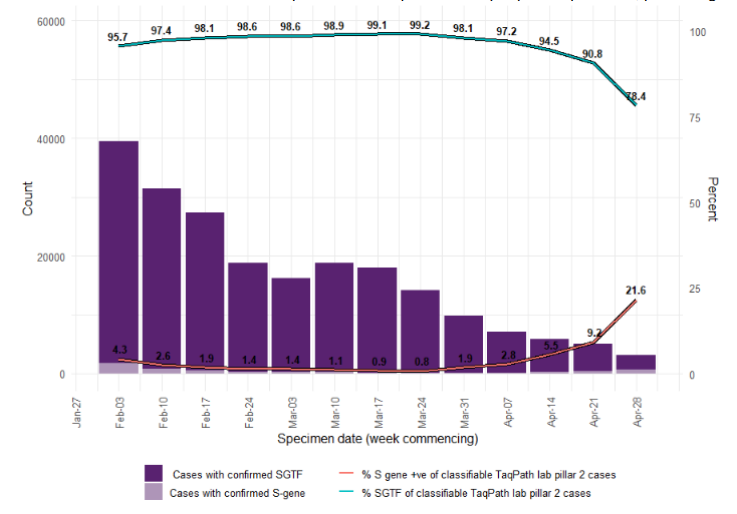
Figure 17. Weekly number and proportion of England Pillar 2 COVID-19 cases with detectable S gene or SGTF among those tested with the TaqPath assay and with S gene detection results, by region of residence (3 February 2021 to 4 May 2021) (Find accessible data used in this graph in underlying data)
Spatial variation in risk for variants
The spatial risk surface is estimated by comparing the smoothed intensity of cases (variants of concern) and controls (PCR +ve, non-variants of concern) across a defined geographical area to produce an intensity (or risk) ratio. If the ratio is ~1, this suggests that the risk of infection is unrelated to spatial location. Evidence of spatial variation in risk occurs where the intensities differ. Ratio values >1 indicate an increased risk and values < 1 indicate lower risk. Figure 18 highlights areas of significantly increased risks, areas of significantly increased risk were identified for VUI-21APR-01 and VOC-21APR-02. Supplementary data is not available for this figure.
International surveillance
GISAID includes data on sequences available internationally. As of 4 May 2021 GISAID
data indicates 23 countries (including the U.K) have reported at least one case of the VUI21APR-01,
VOC-21APR-02 and VUI-21APR-03 variants, which 19 have reported via
official or media sources, or via IHR/EWRS. As of 4 May 2021 sequences from the
following countries (excluding UK) have been identified on GISAID meeting each of the
April Variant Definitions:
• VUI-21APR-01 (B.1.617.1): Australia (16), Bahrain (8), Belgium (5), Canada
(2), Czech Republic (2), Germany (23), Greece (1), Guadeloupe (2), Hong
Kong (7), India (856), Italy (1), Jordan(3), Malaysia (1), Mexico (1), Netherlands
(4), New Zealand (4), Portugal (7), Republic of Ireland (4), Saint Martin (2),
Singapore (51), South Korea (5), Sweden (2), Switzerland (3), USA (108)
• VOC-21APR-02 (B.1.617.2): Aruba (1), Australia (30), Bahrain (14), Belgium
(4), France (1), Germany (28), Greece (1), Hong Kong (1), India (169), Italy (2),
Netherlands (2), New Zealand (7), Poland (1), Republic of Ireland (6), Romania
(1), Singapore (72), Spain (3), Sweden (2), Switzerland (6), USA (135)
• VUI-21APR-03 (B.1.617.2): India (36), Russia (2), USA (1)
Secondary attack rates
Secondary attack rates are shown in Table 9. These are based on positive tests amongst
contacts named to NHS Test and Trace by an original case identified with a confirmed or
probable variant of concern or variant under investigation.
Secondary attack rates are shown for cases with and without travel history. In non-travel
settings, only close contacts (household members, face to face contact, people within 1
metre of the case for 1 minute or longer, or people within 2 metres for 15 minutes) named
by the original case are included. In travel settings the contacts reported are not restricted
to only close contacts named by the case (for example, they may include contacts on a
plane linked by additional contact tracing efforts), leading to likely deflation of secondary
attack rates amongst travellers compared to non-travellers. In addition, people recently
returning from overseas are subject to stricter quarantine measures and may moderate
their behaviour towards contacts. Travel history indicates, but does not confirm, where
infection of the original case occurred.
Secondary attack rates for contacts of non-travel cases with VUI-21APR-01, VOC-21APR02
or VUI-21APR-03 were not significantly different from that for contacts of non-travel
cases with VOC-20DEC-01. Estimates of secondary attack rates for contacts of those that
have travelled with variants of concern or variants under investigation were all
considerably lower than those that have not travelled. Secondary attack rates for contacts
of travel cases with VOC-21APR-02 were higher than those for travel cases with VOC20DEC-01.
| Variant | Cases in those that have travelled (% with contacts) | Cases in those that have not travelled or unknown (% with contacts) | Case prop ortion that have trav elled | Secondary Attack Rate among contacts of those that have travelled (95% CI) [secondary cases/conta cts] | Secondary Attack Rate among contacts of cases that have not travelled or unknown (95% CI) [secondary cases/contacts] |
| VOC-20DEC-01 | 3,197(79.8%) | 151,776(73.8%) | 2.1% | 1.7%(1.6%-1.8%)[1,041/60,130] | 10.1%(10.0%-10.2%)[31,177/309,069] |
| VUI-21APR-01 | 120(84.2%) | 33(81.8%) | 78.4% | 1.9%(1.5%-2.5%)[56/2,957] | 9.6%(5.0%-17.9%)[8/83] |
| VOC-21APR-02 | 80(81.2%) | 60(81.7%) | 57.1% | 3.3%(2.5%-4.2%)[60/1,845] | 9.5%(5.9%-14.9%)[16/168] |
| VUI-21APR-03 | 3(33.3%) | 2(100.0%) | 60.0% | Unavailable[1/3] | Unavailable[0/3] |
Secondary attack rates are marked as ‘Unavailable’ when count of contacts is less than 50 or count of exposing cases is less than 20. Travel-linked cases for secondary attack rates are identified positively in NHS Test and Trace data using multiple PHE sources. A case is considered as being travel-linked if EpiCell or Health Protection Teams have found evidence of international travel, their NHS Test and Trace record mentions an event associated with international travel, their NHS Test and Trace record was created after notification via IHR NFP or they have been marked for priority contact tracing in NHS Test and Trace for reasons of travel. Some travel-linked cases may be missed by these methods and would be marked as non-travel-linked or unknown. Secondary attack rates from NHS Test and Trace should generally be considered lower bounds due to the nature of contact tracing and testing. Data provided is for period 5 January 2021 to 12 April 2021 in order to allow time for contacts to become cases, hence case counts are lower than other sources.
Sources and acknowledgments
Data sources
Data used in this investigation is derived from the COG-UK dataset, the PHE Second
Generation Surveillance System (SGSS), NHS Test and Trace, the Secondary Uses
Service (SUS) dataset and Emergency Care Data Set (ECDS).
Variant Technical Group
Authors of this report
PHE Genomics Cell
PHE Outbreak Surveillance Team
PHE Epidemiology Cell
PHE Contact Tracing Data Cell
Variant Technical Group Membership
The PHE Variant Technical Group includes representation from the following
organisations: PHE, DHSC, BEIS, Public Health Wales , Public Health Scotland, Public
Health Agency Northern Ireland, Imperial College London, London School of Hygiene and
Tropical Medicine, University of Birmingham, University of Cambridge, University of
Edinburgh, University of Liverpool, the Wellcome Sanger Institute.
Acknowledgements
The authors are grateful to those teams and groups providing data for this analysis
including: the Lighthouse Laboratories, COG-UK, the Wellcome Sanger Institute, tthe PHE
Epidemiology Cell, Contact Tracing, Genomics and Outbreak Surveillance Teams.
Published: May 2021
PHE gateway number: GW-8226