


SARS-CoV-2 variants of concern and variants under investigation in England
Technical briefing 11
13 May 2021
This briefing provides an update on previous briefings up to 7 May 2021
Summary
There are 5 variants of concern and 7 variants under investigation (Table 1).
This report has been published to continue to share detailed surveillance of VOC-21APR02
(B.1.617.2). A separate report is published covering our routine data on all other VOCs
and VUIs. These additional specialist technical briefings represent early data and analysis
on an emerging variant and findings have a high level of uncertainty.
Whilst case numbers in general remain very low, the proportion of cases which are VOC21APR-02
(B.1.617.2) has increased, as monitored through both genomic and S gene
target data. This is most pronounced in London and the North West.
The proportion of S gene target positives continues to increase rapidly, but the proportion
of VOC-21APR-02 (B.1.617.2) genomes amongst all sequenced cases has a slower
increase in the most recent data. Genomic data from the most recent period shown is still
being produced and this picture may be related to sequencing lag or alternatively to biases
in the S gene data related to geographic coverage.
In a small number of areas there are both rising incidence rates and a high proportion of
VOC-21APR-02 (B.1.617.2).
Surveillance of travellers from India shows a predominance of VOC-21APR-02 (B.1.617.2)
amongst imported cases.
Secondary attack rates for VOC-21APR-02 (B.1.617.2) are similar to those for VOC20DEC-01
(B.1.1.7) in non-travellers and slightly higher for travellers. Small numbers of
non-travel VOC-21APR-02 (B.1.617.2) cases mean these results should be interpreted
with caution and will be refined with further cases.
Routine reinfection surveillance shows a small number of potential reinfection cases with
VOC-21APR-02 (B.1.617.2). This would be expected with any prevalent variant;
comparative analyses have been initiated.
The updated VOC-21APR-02 (B.1.617.2) risk assessment will be published separately on
14 May 2021.
Published information on variants
The collection page gives content on variants, including prior technical briefings. Definitions for variants of concern, variants under investigation and signals in monitoring are detailed in technical briefing 8. Data on variants not detailed here is published in the variant data update. Variant risk assessments are available in prior technical briefings. A repository containing the up-to-date genomic definitions for all variants of concern (VOC) and variants under investigation (VUI) as curated by Public Health England was created 5 March 2021. The repository can be accessed on GitHub.
Published information on variants
Variants under surveillance
Table 1 shows the current variants of concern (VOC) and variants under investigation (VUI). Summary epidemiology on each variant is shown in Table 2, case numbers are also updated online.
| Lineage | Designation | First detected in sequence from | Status |
| B.1.1.7 | VOC-20DEC01 | UK | VOC |
| B.1.351 | VOC-20DEC02 | South Africa | VOC |
| P1 | VOC-21JAN-02 | Japan ex Brazil | VOC |
| B1.1.7 with E484K | VOC-21FEB02 | UK | VOC |
| B.1.617.2 | VOC-21APR-02 | India | VOC |
| P2 | VUI-21JAN-01 | Brazil | VUI |
| A.23.1 with E484K | VUI-21FEB-01 | UK | VUI |
| B.1.525 | VUI-21FEB-03 | UK | VUI |
| B.1.1.318 | VUI-21FEB-04 | UK England | VUI |
| P3 | VUI-21MAR-02 | Philippines | VUI |
| B.1.617.1 with E484Q | VUI-21APR-01 | India | VUI |
| B.1.617.3 | VUI-21APR-03 | India | VUI |
| B.1.429 | Monitoring | ||
| B.1.1.7 with S494P | Monitoring | ||
| A.27 | Monitoring | ||
| B.1.526 | Monitoring | ||
| B.1.1.7 with Q677H | Monitoring | ||
| B.1.620 | Monitoring | ||
| B1.214.2 | Monitoring | ||
| B.1.1.1 with L452Q and F490S | Monitoring | ||
| R.1 | Monitoring | ||
| B.1.1.28 with N501T and E484Q | Monitoring | ||
| C.36 | Monitoring | ||
| B.1.621 | Monitoring | ||
| B.1 with 214insQAS | Monitoring | ||
| AV.1 | Monitoring |
Sequencing coverage
Figure 1 shows the proportion of cases which are sequenced in England.
Figure 1. Coverage of sequencing: percentage of SARS-CoV-2 cases sequenced over time as of 12 May 2021(Find accessible data used in this graph in underlying data)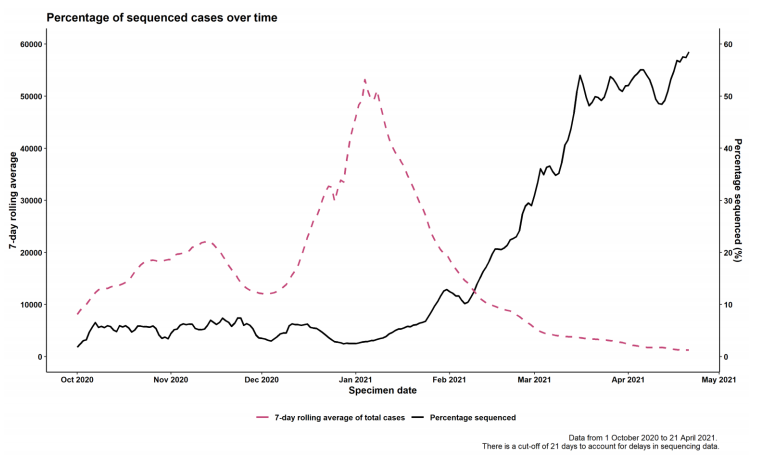
VOC and VUI case numbers, proportion, deaths and case fatality rate
The number of cases of variants of concern and variant under investigation are shown in Table 2. including the proportion of variant cases compared to all sequenced cases, deaths and case fatality rate. Figure 2 shows the cumulative number of cases per variant indexed by days since first report.
| Variant | Case Number | Case Proportion | Deaths | Case Fatality |
| VOC-20DEC-01 | 202,229 | 98.425% | 4,103 | 2.0%(2.0-2.1%) |
| VOC-20DEC-02 | 772 | 0.376% | 12 | 1.6%(0.8-2.7%) |
| VOC-21FEB-02 | 43 | 0.021% | 1 | 2.3%(0.1-12.3%) |
| VOC-21JAN-02 | 102 | 0.05% | 0 | 0.0%(0.0-3.6%) |
| VUI-21APR-01 | 330 | 0.161% | 0 | 0.0%(0.0-1.1%) |
| VOC-21APR-02 | 1,255 | 0.611% | 4 | 0.3%(0.1-0.8%) |
| VUI-21APR-03 | 11 | 0.005% | 0 | 0.0%(0.0-28.5%) |
| VUI-21FEB-01 | 79 | 0.038% | 2 | 2.5%(0.3-8.8%) |
| VUI-21FEB-03 | 393 | 0.191% | 12 | 3.1%(1.6-5.3%) |
| VUI-21FEB-04 | 190 | 0.092% | 1 | 0.5%(0.0-2.9%) |
| VUI-21JAN-01 | 54 | 0.026% | 1 | 1.9%(0.0-9.9%) |
| VUI-21MAR-02 | 6 | 0.003% | 0 | 0.0%(0.0-45.9%) |
Excludes variant cases not linked to a known COVID-19 case or with provisional sequencing/genotyping results. aCase number England genomic cases 12 May 2021. bDeaths As of 12 May 2021 (within 28 days) with confirmed or probable VOC or total cases. c95% Confidence Intervals calculated with Clopper–Pearson exact method, using R package PropCIs.
Figure 2. Cumulative cases in England of variants indexed by days since first reported, data as of 12 May 2021 (Find accessible data used in this graph in underlying data). Figure 2 demonstrates the rapid identification of B.1.617.2 cases over a short period of time.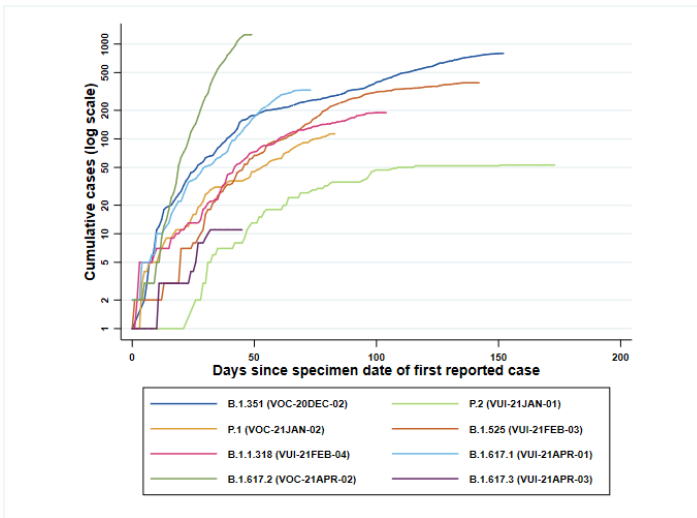
Variant prevalence
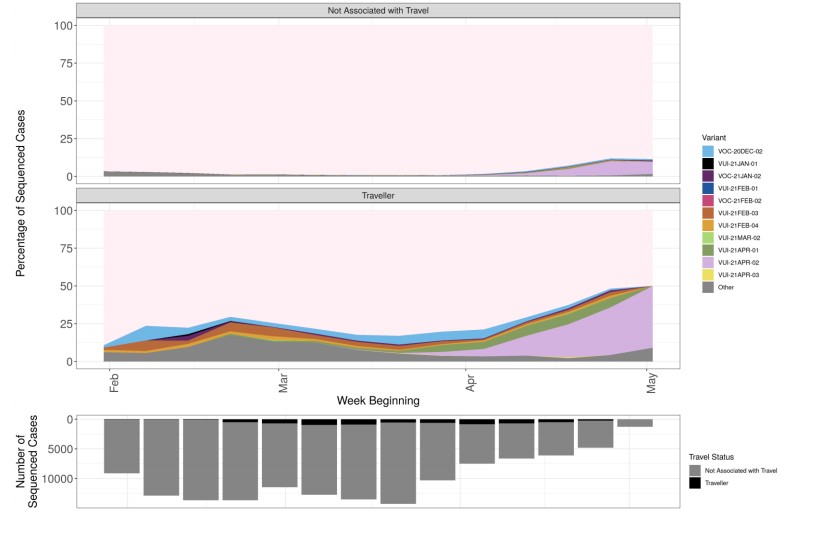
The prevalence of different variants amongst all sequenced cases is presented in
Figure 3, split by region in Figure 4 and by travel status in Figure 5. The ‘Other’ category in
Figure 3 and Figure 4 includes genomes where the quality is insufficient to determine
variant status and genomes that do not meet the current definition for any designated
variant under investigation or variant of concern. The total genomic dataset used for this
assessment includes enhanced testing and sequencing from individuals who have
travelled, and surge testing and sequencing in outbreak areas. Sequencing numbers and
coverage fall in the last week shown due partly to sequencing lag time, and new
sequences are still being produced relating to sample dates in that week. The
supplementary data for figures is available.
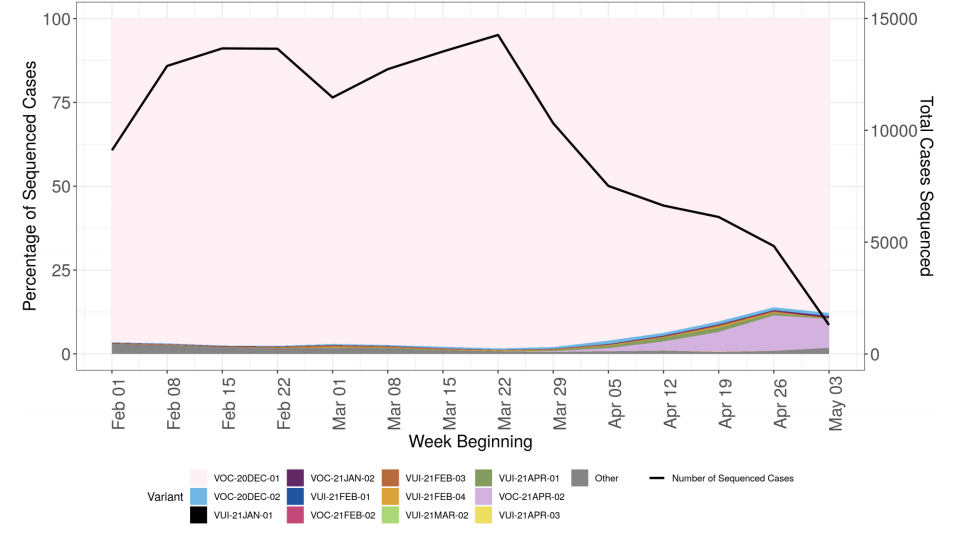
Figure 4. Variant prevalence for all England available case data from 1 February 2021 as of 12 May 2021 by region (Excluding cases where the region or specimen date were unknown). Black line indicates total number of cases sequenced (Find accessible data used in this graph in underlying data). Data for most recent 2 weeks is incomplete.
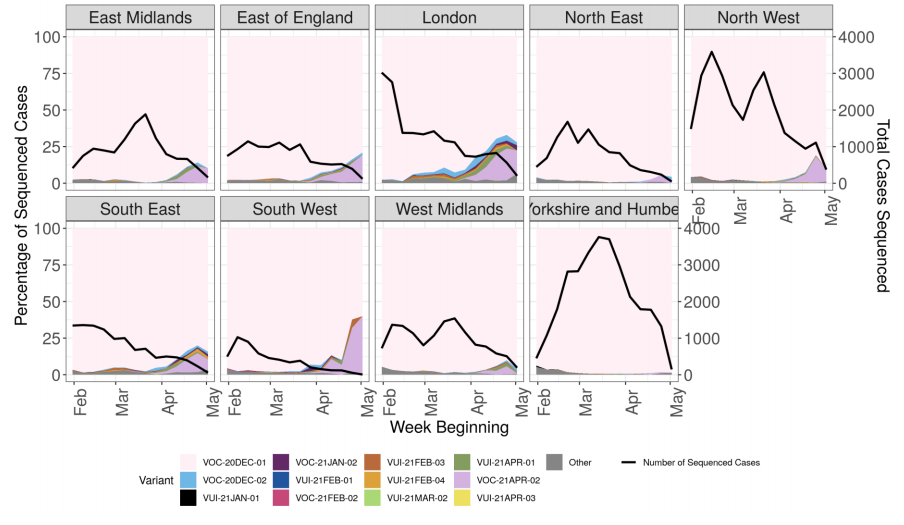
Figure 5. Prevalence of variants over time: all sequenced cases in England, split by travel status as of 12 May 2021(Find accessible data used in this graph in underlying data). Travel status includes cases matched to Passenger Locator Form data and samples taken as part of the managed quarantine service or through private testing following travel. The total number of sequenced cases in each week is shown in the bars below, split by travel status.
Growth rates
Logistic growth rates (1/week from 1 January 2021 as of 12 May 2021) relative to lineage
B.1.1.7 are calculated for each VUI or VOC with more than 20 samples and shown in
Table 3. Sample inclusion criteria are: 1) A non-traveller as determined by matching each
case against passenger locator forms and managed quarantine service test codes 2)
Collected from Pillar 2 testing. 3) If multiple sequences are collected from the same patient
which show the same variant, the first sample is retained. Additionally, samples with
missing or unknown date of sample collection or upper tier local authority (UTLA) of
residence are excluded.
A sample of B.1.1.7 is collected for measuring relative growth rates by weighting each
B.1.1.7 sample by the proportion of the VUI or VOC which are sampled in each UTLA. Any
B.1.1.7 samples collected outside the period of time that the VUI or VOC are observed are
excluded as are B.1.1.7 samples collected in UTLAs where the VUI or VOC have not yet
been detected. The growth rate is estimated by logistic regression of the variant on time of
sample collection. A growth rate of 0 would indicate parity with B.1.1.7.
Compared to lineage B.1.1.7, the growth rate for B.1.617.2 displays an increased growth
rate. Growth rate is context dependent and cannot be interpreted as a change in biological
transmissibility.
| Variant | Growth rate | |
| VOC-20DEC-02 | 0.19 | (p=4.336e-34,n=283) |
| VUI-21JAN-01 | -0.16 | (p=0.01946,n=22) |
| VOC-21JAN-02 | 0.62 | (p=1.569e-11,n=40) |
| VUI-21FEB-01 | -0.25 | (p=0.004,n=55) |
| VUI-21FEB-03 | 0.041 | (p=0.045,n=150) |
| VUI-21FEB-04 | 0.19 | (p=1.854e-09,n=90) |
| VUI-21APR-01 | 0.61 | (p=5.089e-22,n=111) |
| VOC-21APR-02 | 1.1 | (p=6.591e-142,n=835) |
Surveillance of reinfections
Individuals who have 2 positive tests (PCR and/or LFD) at least 90 days apart are classed
as possible reinfection cases. A small proportion of reinfections have been sequenced
through standard national surveillance sequencing. Table 4 shows the total number of
sequences available from second episodes of infection in possible reinfection cases,
categorized by variant. Figure 6 shows the number of different variants identified through
sequencing that are possible reinfection cases. In recent weeks there have been small
numbers of reinfection with VOC-21APR-02. This is expected with any prevalent variant;
comparative analyses are underway.
| Variant | Total |
| VOC-20DEC-01 | 487 |
| VOC-20DEC-02 | 1 |
| VUI-21JAN-01 | 0 |
| VOC-21FEB-02 | 1 |
| VUI-21FEB-03 | 2 |
| VUI-21FEB-04 | 2 |
| VUI-21APR-01 | 2 |
| VOC-21APR-02 | 13 |
| VUI-21APR-03 | 0 |
| Total sequenced | 714 |
The total potential reinfection figure includes all tests (for example lateral flow devices as well as PCR tests).
Figure 6. The number of reinfections cases from all sample sources, with the total number of reinfections cases with sequences, and the number of variant sequences over time (Find accessible data used in this graph in underlying data)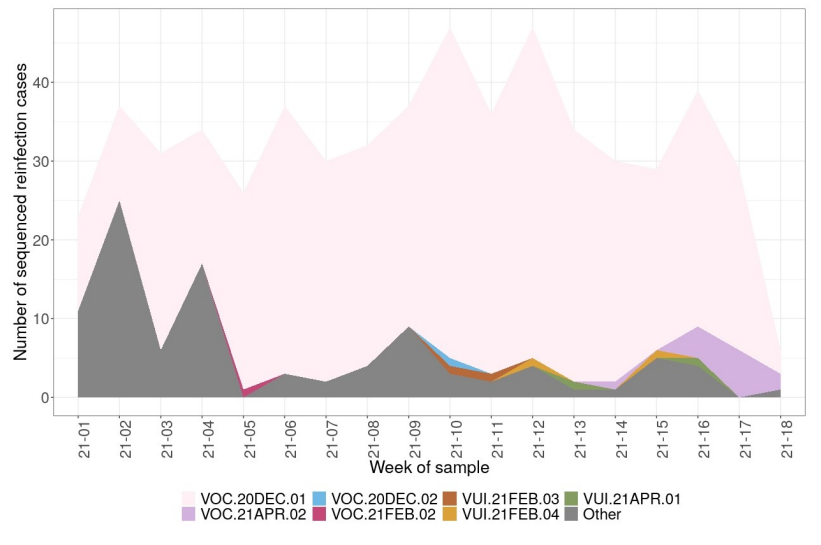
Part 2: VOC-21APR-02 surveillance
Surveillance through genomic data
| Region | Case Number | Case Proportion | Cases that have travelled | Proportion of travellers among cases |
| East Midlands | 129 | 10.3% | 31 | 24% |
| East of England | 152 | 12.1% | 46 | 30.3% |
| London | 400 | 31.9% | 106 | 26.5% |
| North East | 19 | 1.5% | 3 | 15.8% |
| North West | 319 | 25.4% | 24 | 7.5% |
| South East | 98 | 7.8% | 46 | 46.9% |
| South West | 39 | 3.1% | 26 | 66.7% |
| West Midlands | 62 | 4.9% | 28 | 45.2% |
| Yorkshire and Humber | 31 | 2.5% | 16 | 51.6% |
| Unknown region | 6 | 0.5% | NA% |
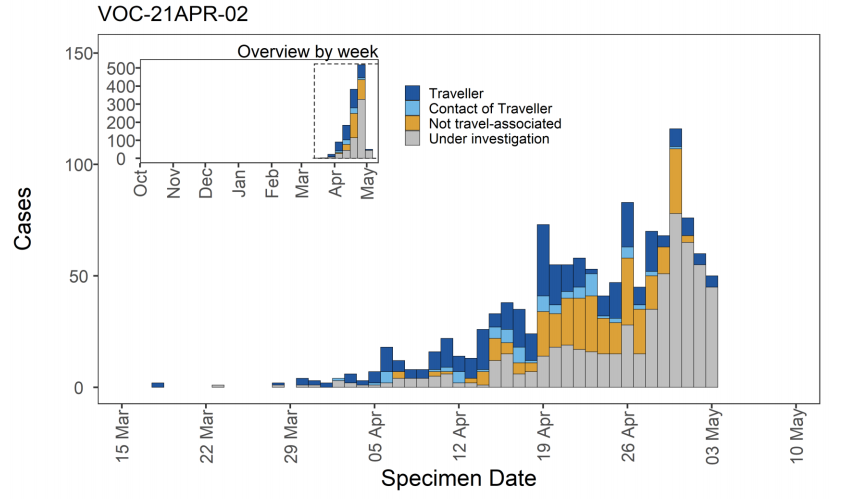
Figure 7. Confirmed and probable VOC-21APR-02 (B.1.617.2) cases by specimen date as of 12 May 2021 Larger plot includes last 60 days only. (Find accessible data used in this graph in underlying data)
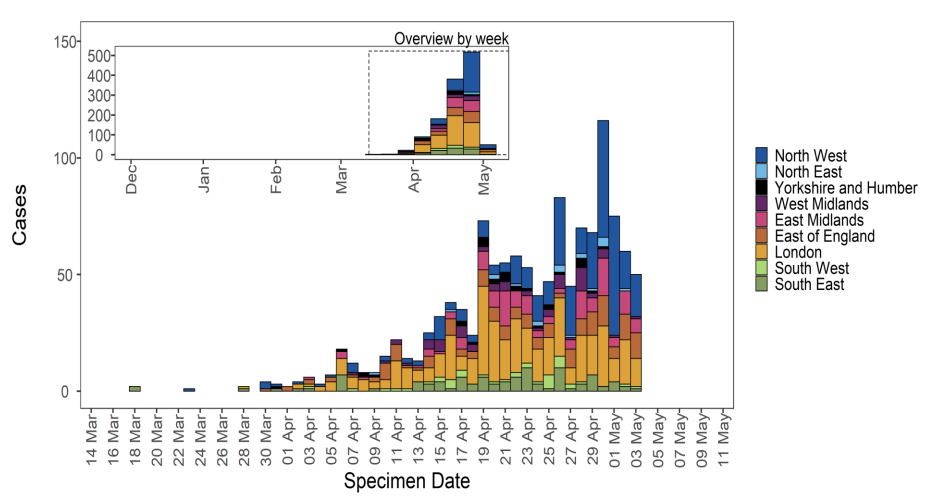
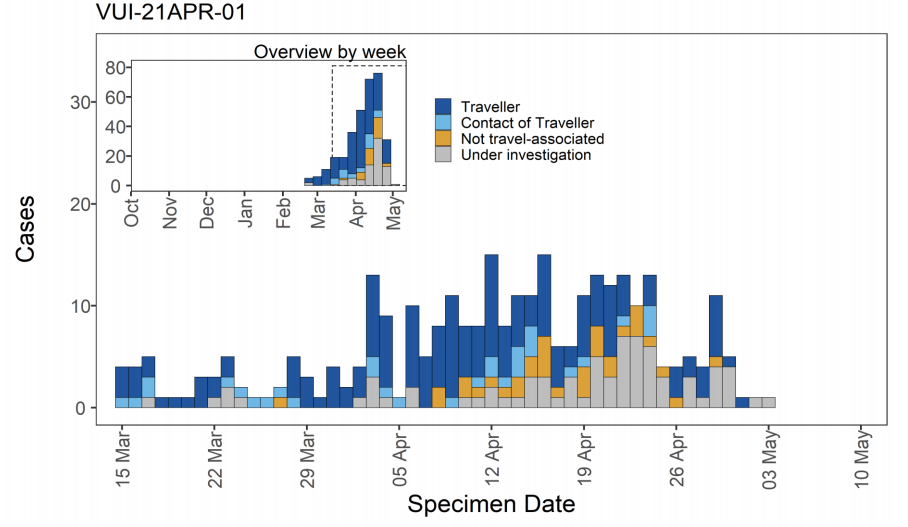
Figure 8. Travel data for confirmed and probable VOC-21APR-02 (B.1.617.2) cases by specimen date as of 12 May 2021 Larger plot includes last 60 days only. (Find accessible data used in this graph in underlying data) N/A indicates information is pending or not available.
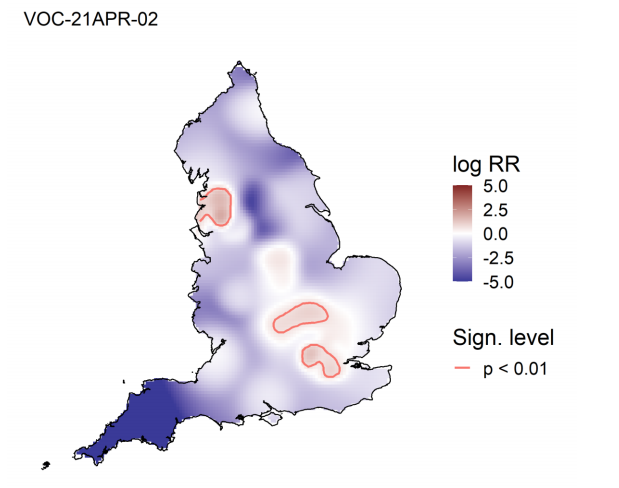
Spatial variation in risk for variants
The spatial risk surface is estimated by comparing the smoothed intensity of cases
(variants of concern) and controls (PCR +ve, non-variants of concern) across a defined
geographical area to produce an intensity (or risk) ratio. If the ratio is ~1, this suggests that
the risk of infection is unrelated to spatial location. Evidence of spatial variation in risk
occurs where the intensities differ. Ratio values >1 indicate an increased risk and values <
1 indicate lower risk. Figure 9 highlights areas of significantly increased risk identified for
VOC-21APR-02.
Secondary attack rates
Secondary attack rates for VOC-21APR-02 (B.1.617.2) compared to the other B.1.617.2
lineages and VOC-20DEC-01 (B.1.1.7) are shown in Table 6. These are based on positive
tests amongst contacts named to NHS Test and Trace by an original case identified with a
confirmed or probable variant of concern or variant under investigation.
Secondary attack rates are shown for cases with and without travel history. In non-travel
settings, only close contacts (household members, face to face contact, people within 1
metre of the case for 1 minute or longer, or people within 2 metres for 15 minutes) named
by the original case are included. In travel settings the contacts reported are not restricted
to only close contacts named by the case (for example, they may include contacts on a
plane linked by additional contact tracing efforts), leading to likely deflation of secondary
attack rates amongst travellers compared to non-travellers. In addition, people recently
returning from overseas are subject to stricter quarantine measures and may moderate
their behaviour towards contacts. Travel history indicates, but does not confirm, where
infection of the original case occurred.
Secondary attack rates for contacts of non-travel cases with VUI-21APR-01, VOC-21APR02
or VUI-21APR-03 were not significantly different from that for contacts of non-travel
cases with VOC-20DEC-01. Estimates of secondary attack rates for contacts of those that
have travelled with variants of concern or variants under investigation were all
considerably lower than those that have not travelled. Secondary attack rates for contacts
of travel cases with VOC-21APR-02 were higher than those for travel cases with VOC20DEC-01.
| Variant | Cases in those that have travelled (% with contacts) | Cases in those that have not travelled or unknown (% with contacts) | Case prop ortion that have trav elled | Secondary Attack Rate among contacts of those that have travelled (95% CI) [secondary cases/conta cts] | Secondary Attack Rate among contacts of cases that have not travelled or unknown (95% CI) [secondary cases/contacts] |
| VOC-20DEC01 | 3663 (78.5% with contacts) | 158692 (74.0% with contacts) | 2.3% | 1.7% (1.6% - 1.8%) [1128/65383] | 10.0% (9.9% - 10.1%) [32591/326364] |
| VUI-21APR-01 | 171 (80.7% with contacts) | 81 (77.8% with contacts) | 67.9% | 2.0% (1.6% - 2.5%) [70/3469] | 12.0% (8.1% - 17.3%) [23/192] |
| VOC-21APR-02 | 250 (72.4% with contacts) | 287 (80.5% with contacts) | 46.6% | 3.3% (2.8% - 3.9%) [128/3884] | 11.5% (9.6% - 13.9%) [98/850] |
| VUI-21APR-03 | 5 (20.0% with contacts) | 5 (100.0% with contacts) | 50.0% | Unavailable [1/3] | Unavailable [1/12] |
Secondary attack rates are marked as ‘Unavailable’ when count of contacts is less than 50
or count of exposing cases is less than 20. Travel-linked cases for secondary attack rates
are identified positively in NHS Test and Trace data using multiple PHE sources. A case is
considered as being travel-linked if EpiCell or Health Protection Teams have found
evidence of international travel, their NHS Test and Trace record mentions an event
associated with international travel, their NHS Test and Trace record was created after
notification via IHR NFP or they have been marked for priority contact tracing in NHS Test
and Trace for reasons of travel.
Some travel-linked cases may be missed by these methods and would be marked as nontravel-linked
or unknown. Secondary attack rates from NHS Test and Trace should
generally be considered lower bounds due to the nature of contact tracing and
testing. Data provided is for period 5 January 2021 to 21 April 2021 in order to allow time
for contacts to become cases, hence case counts are lower than other sources.
Provisional results are excluded.
Surveillance of cases in travellers from India
Figure 10. Lineages of cases with recent travel history from IndiaEach line shows the count of cases of that lineage with known travel history from India: B.1.1.7 in green, B.1.617.1 in blue, B.1.617.2 in cyan, other lineages as dashed line (22 February 2021 to 2 May 2021).(Find accessible data used in this graph in underlying data).
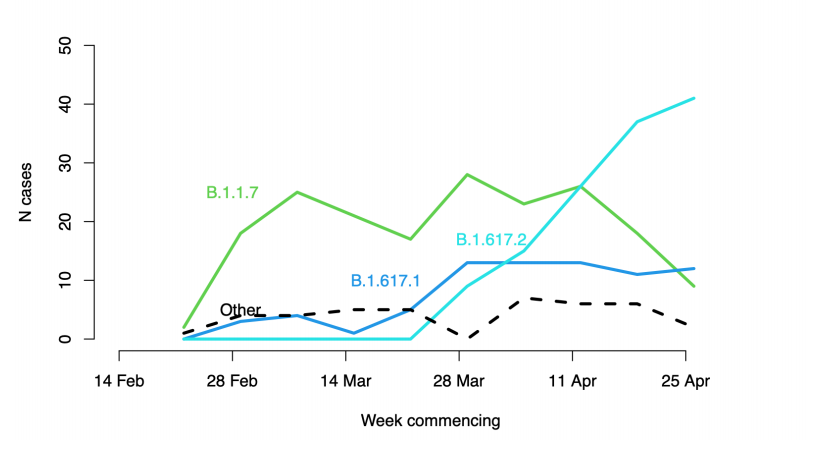
Figure 11. Lineages of cases from selected cities of departure within India.Larger plot includes last 60 days only. (Find accessible data used in this graph in underlying data).
Surveillance through S gene detection
The S gene target in a specific 3-target assay used in some Lighthouse Laboratories fails
in B.1.1.7, previously predominant, but is detected in VUI-21APR-01, VOC-21APR-02 and
VUI-21APR-03 variants as well as VOC-20DEC02 (B.1.351) and some others. Specimens
with a detectable S gene (also referred to as S gene positive) are defined as those with
cycle threshold (CT) values of ≤30 in all 3 gene targets: S, N, and ORF1ab.
Figure 12 shows the number of sequenced S gene positive isolates over time since 1
January 2021 (data as of 12 May 2021), as well as the distribution of identified variants
among these specimens. Unclassified variants refer to those not considered a VOC or
VUI; these dominated the sequenced S gene positive specimens at the beginning of 2021,
and decreased in proportion towards the end of April 2021 (Figure 12). Among 789
sequenced S gene positive samples in the second half of April 2021, 96% (n = 754) were
variants under investigation or of concern, and 72.2% were VOC-21APR-02 (n=570).
Among 397 specimens taken in May so far, 93% are VOC-21APR-02 (n=368). This
suggests trends in S gene positive cases may currently capture additional VOC-21APR-02
cases not detected through sequencing, however this proxy is limited by variable TaqPath
laboratory coverage across England (Figure 13). Additionally biases in sequencing, for
instance targeting of contacts of variant cases in outbreak settings, may result in
overrepresentation of variants among the S gene positive sequences.
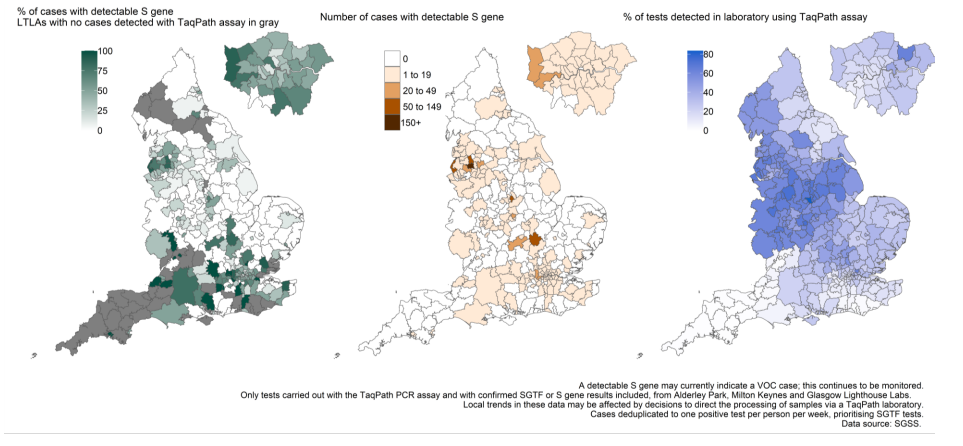
The number of sequenced S gene positive samples (Figure 12) as well as the number and
proportion of S gene positive samples nationally (Figure 14) has increased in recent
weeks, particularly in North West England and London (Figure 15). Many of the recent S
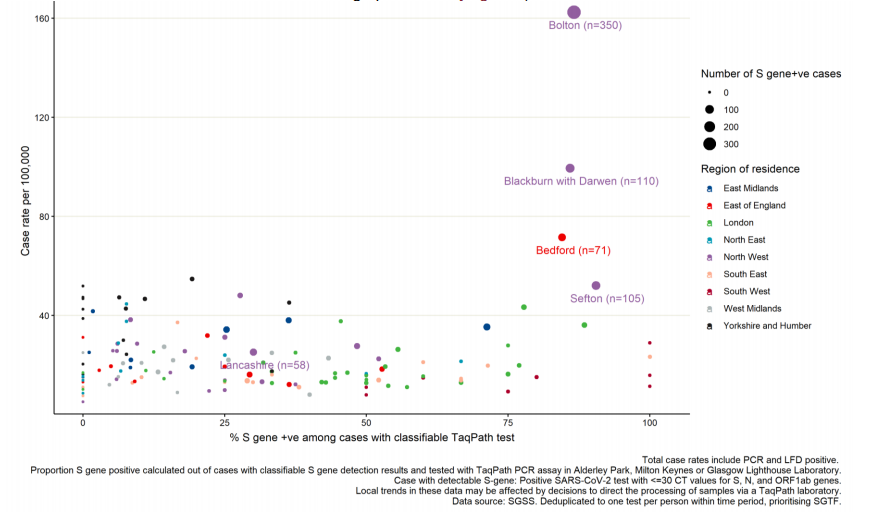
gene positive cases have been detected in a small number of local authorities which have
high total case rates, including Bolton, Blackburn with Darwen, Bedford, and Sefton
(Figures 13 and 16). Some of these are located in areas where a higher proportion of
specimens are tested in laboratories which use the TaqPath PCR assay (Figure 13).
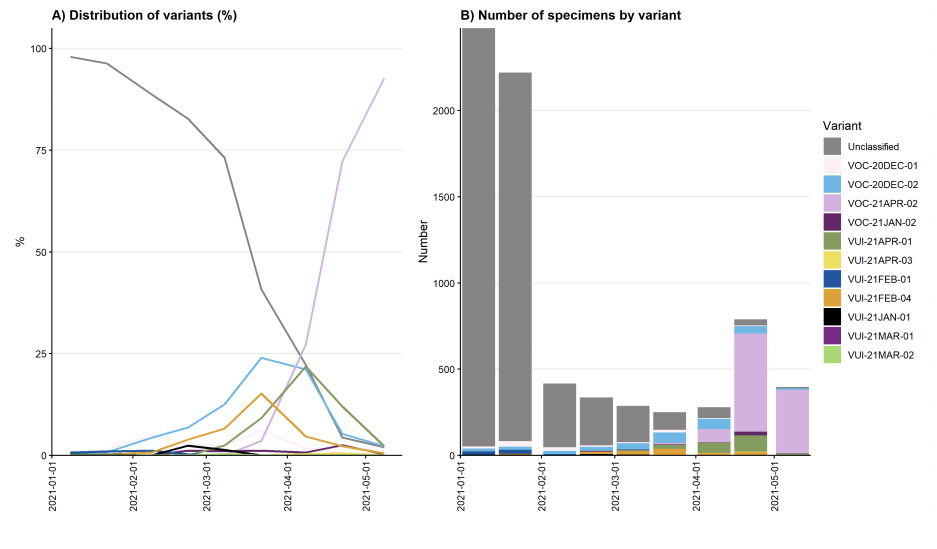
Figure 13. Confirmed and probable VUI-21APR-03 (B.1.617.3) cases by specimen date as of 5 May 2021 Each line shows the count of cases of that lineage with a listed port of departure from a particular city: Mumbai in black, Delhi in red. For each city, the dashed line is B.1.617.1, the solid line B.1.617.2. (22 February 2021 to 2 May 2021).
Figure 14. Weekly number and proportion of England Pillar 2 COVID-19 cases with SGTF and detectable S gene among those tested with the TaqPath assay. Specimen dates between 2 September 2020 to 11 May 2021, data as of 12 May 2021 (Find accessible data used in this graph in underlying data).
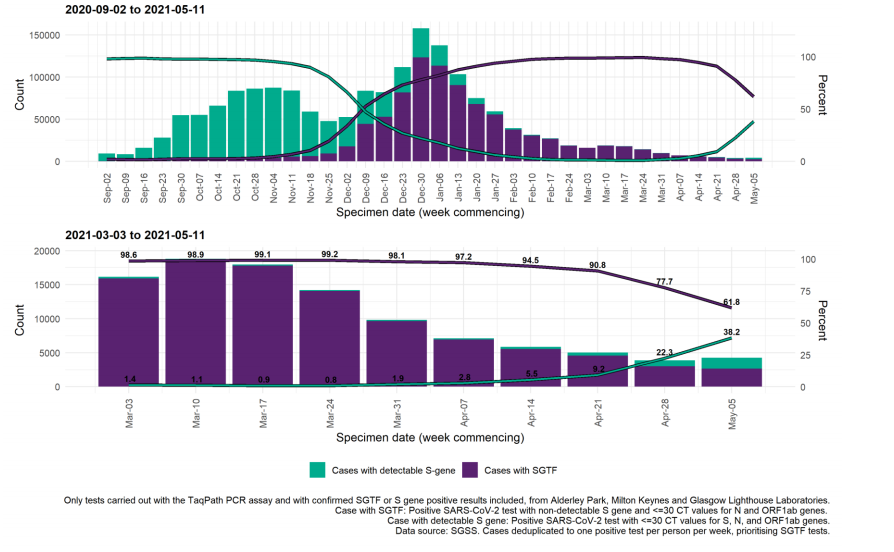
Figure 15. Weekly number and proportion of England Pillar 2 COVID-19 cases with detectable S gene or SGTF among those tested with the TaqPath assay, by region of residence. Specimen dates between 1/1/2021 and 26/04/2021 (latest period incomplete. Find accessible data used in this graph in underlying data).
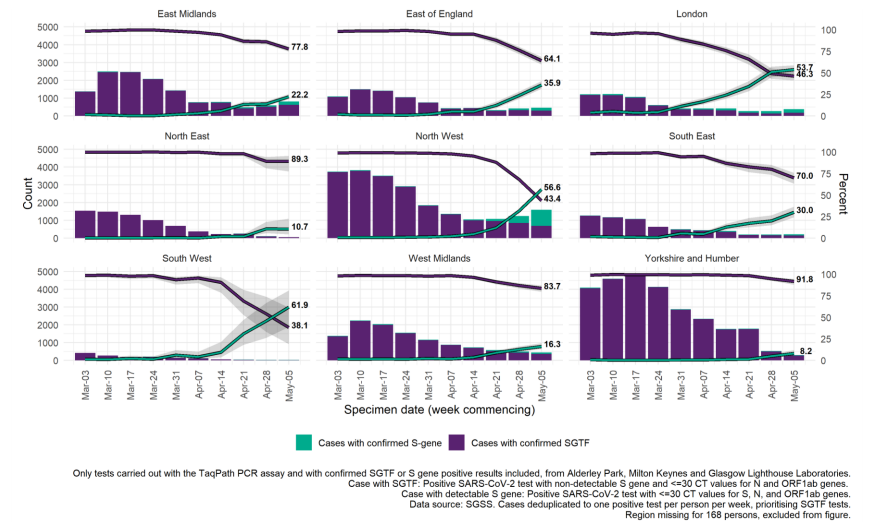
Figure 16. Weekly number and proportion of England Pillar 2 COVID-19 cases with detectable S gene or SGTF among those tested with the TaqPath assay and with S gene detection results (3 February 2021 to 4 May 2021) Specimen dates between 2 May 2021 and 8 May 2021, data as of 12 May 2021 (3 most recent days excluded due to reporting delay). Five UTLAs with highest number of S gene positive cases labelled. Find accessible data used in this graph in underlying data).
Part 3: Other B.1.617 sublineages
VUI-21APR-01 (B.1.617.1)
| Region | Case Number | Case Proportion | Cases that have travelled | Proportion of travellers among cases |
| East Midlands | 44 | 13.3% | 23 | 52.3% |
| East of England | 27 | 8.2% | 17 | 63% |
| London | 145 | 43.9% | 81 | 55.9% |
| North East | 4 | 1.2% | 2 | 50% |
| North West | 29 | 8.8% | 20 | 69% |
| South East | 30 | 9.1% | 19 | 63.3% |
| South West | 6 | 1.8% | 4 | 66.7% |
| West Midlands | 30 | 9.1% | 10 | 33.3% |
| Yorkshire and Humber | 15 | 4.5% | 11 | 73.3% |
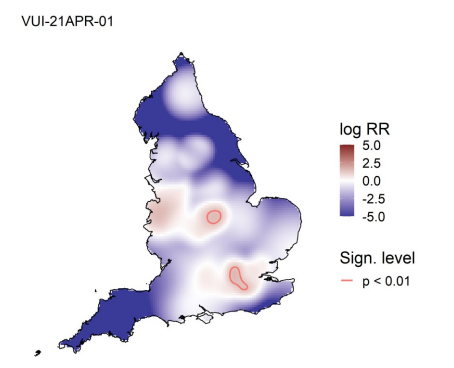
Figure 18. Confirmed and probable VUI-21APR-01 (B.1.617.1) cases by specimen date as of 12 May 2021. Larger plot includes last 60 days only. (Find accessible data used in this graph in underlying data).
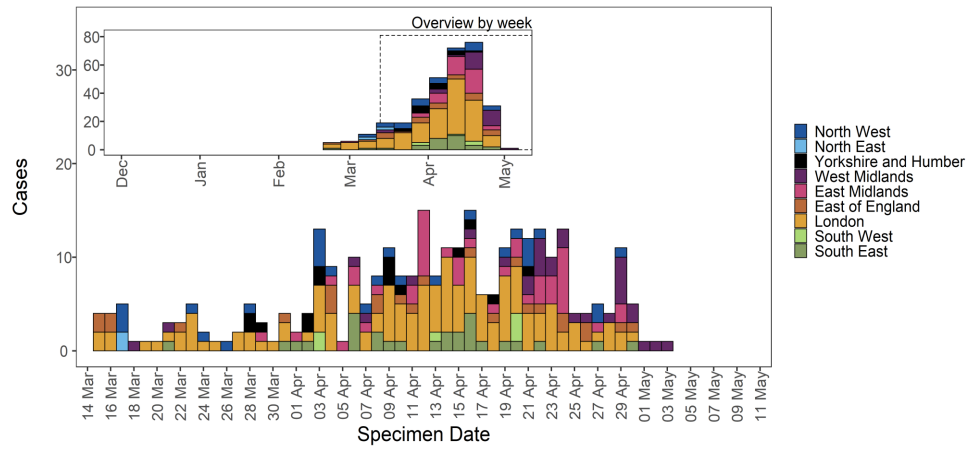
Figure 19. Travel data for confirmed and probable VUI-21APR-01 (B.1.617.1) cases by specimen date as of 12 May 2021 Larger plot includes last 60 days only. (Find accessible data used in this graph in underlying data). N/A indicates information is pending or not available.
VUI-21APR-03 (B.1.617.3)
| Region | Case Number | Case Proportion | Cases that have travelled | Proportion of travellers among cases |
| London | 4 | 36.4% | 2 | 50% |
| North West | 6 | 54.5% | 2 | 33.3% |
| South East | 1 | 9.1% | 0 | 0% |
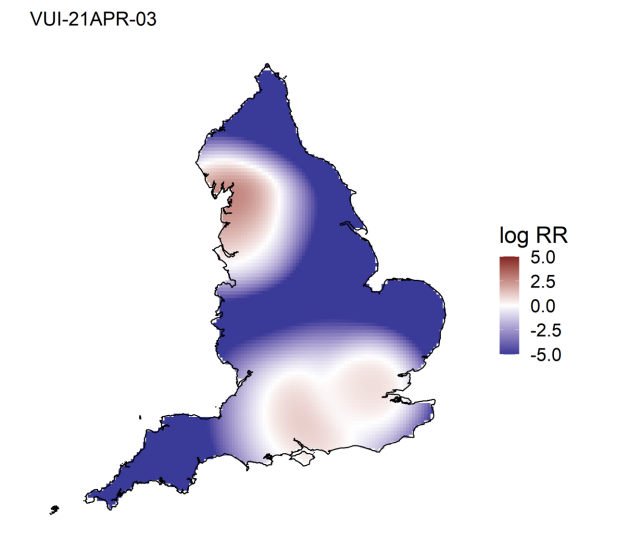
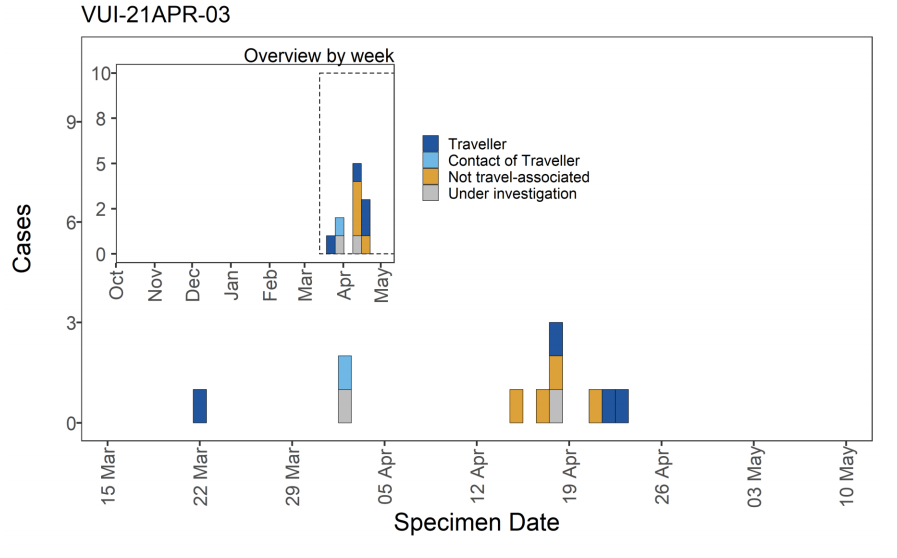
Figure 21. Confirmed and probable VUI-21APR-03 (B.1.617.3) cases by specimen date as of 12 May 2021 Larger plot includes last 60 days only. (Find accessible data used in this graph in underlying data).
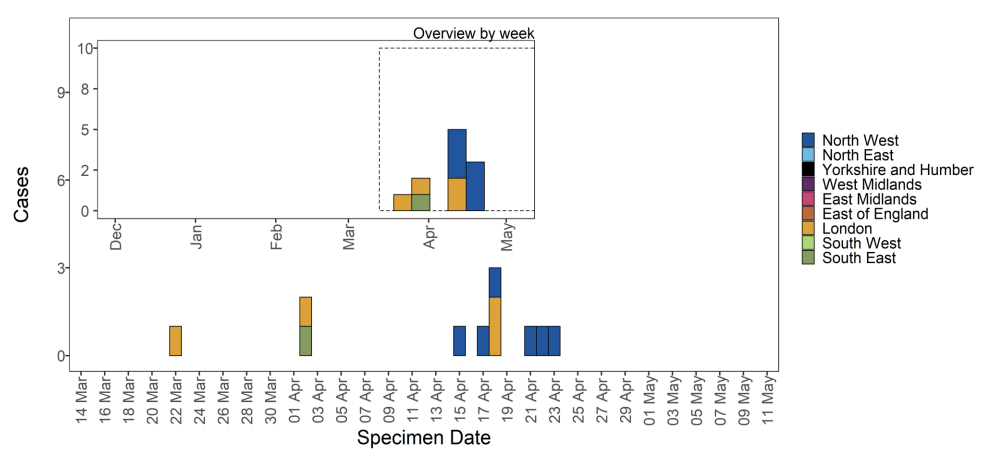
Figure 22. Travel data for confirmed and probable VUI-21APR-03 (B.1.617.3) cases by specimen date as of 12 May 2021Larger plot includes last 60 days only. (Find accessible data used in this graph in underlying data). N/A indicates information is pending or not available.
International surveillance
In total, 59 countries have reported at least one case of the VUI-21APR-01, VOC-21APR-02
and VUI-21APR-03 variants via GISAID, or official or media sources, or via IHR/EWRS.
GISAID includes data on sequences available internationally. As of 12 May 2021 sequences
from the following countries (excluding UK) have been identified in GISAID:
• VUI-21APR-01 (B.1.617.1) Australia (21), Bahrain (8), Belgium (6), Canada (5),
Czech Republic (3), Denmark (21), France (2), Germany (32), Greece (1),
Guadeloupe (2), Hong Kong (9), India (1,069), Ireland (9), Italy (1), Japan (9),
Jordan (3), Luxembourg (5), Malaysia (1), Mexico (1), Netherlands (6), New
Zealand (4), Portugal (7), Saint Martin (2), Singapore (58), South Korea (5), Spain
(1), Sweden (4), Switzerland (6), Thailand (1), USA (137), Uganda (1)
• VOC-21APR-02 (B.1.617.2) Aruba (3), Australia (64), Austria (1), Bahrain (14),
Bangladesh (6), Belgium (15), Canada (1), China (2), Denmark (17), France (13),
Germany (46), Greece (1), Hong Kong (3), India (452), Indonesia (4), Ireland (28),
Italy (18), Japan (19), Luxembourg (2), Malaysia (1), Mexico (1), Netherlands (5),
New Zealand (9), Norway (1), Poland (5), Romania (1), Singapore (100), Slovenia
(1), South Korea (1), Spain (5), Sweden (3), Switzerland (13), USA (211), Uganda
(3)
• VUI-21APR-03 (B.1.617.3) India (47), Russia (2), USA (1)
Sources and acknowledgments
Data sources
Data used in this investigation is derived from the COG-UK dataset, the PHE Second
Generation Surveillance System (SGSS), NHS Test and Trace, the Secondary Uses
Service (SUS) dataset and Emergency Care Data Set (ECDS).
Variant Technical Group
Authors of this report
PHE Genomics Cell
PHE Outbreak Surveillance Team
PHE Epidemiology Cell
PHE Contact Tracing Data Cell
Variant Technical Group Membership
The PHE Variant Technical Group includes representation from the following
organisations: PHE, DHSC, BEIS, Public Health Wales , Public Health Scotland, Public
Health Agency Northern Ireland, Imperial College London, London School of Hygiene and
Tropical Medicine, University of Birmingham, University of Cambridge, University of
Edinburgh, University of Liverpool, the Wellcome Sanger Institute.
Acknowledgements
The authors are grateful to those teams and groups providing data for this analysis
including: the Lighthouse Laboratories, COG-UK, the Wellcome Sanger Institute, tthe PHE
Epidemiology Cell, Contact Tracing, Genomics and Outbreak Surveillance Teams.
Published: May 2021
PHE gateway number: GW-8226