


SARS-CoV-2 variants of concern and variants under investigation in England
Technical briefing 15
11 June 2021
This briefing provides an update on previous briefings up to 3 June 2021
Summary
There are 4 variants of concern and 8 variants under investigation (Table 1).
This report has been published to continue to share detailed surveillance of Delta (VOC21APR-02,
B.1.617.2). A separate report is published covering our routine data on all
other variants of concern and variants under investigation. These additional specialist
technical briefings represent early data and analysis on an emerging variant and findings
have a high level of uncertainty.
Principal changes and findings this week are:
• for the first time this week, published figures include genotyping assay data,
using a highly specific mutation as an indicator of a probable Delta variant
case.
• the most recent data show 74% of sequenced cases and 96% of sequenced
and genotyped cases are Delta.
• the 28-day case fatality rate for Delta remains low (0.1%), though mortality is a
lagged indicator and the vast majority of cases are still within the 28 days of
follow-up required.
• secondary attack rates have been iterated and remain higher for Delta than
Alpha in both traveller and non-traveller cases and amongst both household
and non-household contacts
• early data from both England and Scotland demonstrate an increased risk of
hospitalisation with Delta compared to Alpha
• the majority of outbreaks managed by health protection teams and exposure
settings identified through contact tracing are attributed to Delta variant
The risk assessment for Delta is published separately and has been updated this week.
As Delta is now the dominant variant in the UK, from next week epidemiological data will
be presented in the PHE Weekly Surveillance report and the technical report will focus on
new data that informs the risk assessment.
Published information on variants
The collection page gives content on variants, including prior technical briefings.
Definitions for variants of concern, variants under investigation and signals in monitoring
are detailed in technical briefing 8. Data on variants not detailed here is published in the
variant data update. Variant risk assessments are available in prior technical briefings. A
repository containing the up-to-date genomic definitions for all variants of concern (VOC)
and variants under investigation (VUI) as curated by Public Health England was created
on 5 March 2021. The repository can be accessed on GitHub.
WHO nomenclature as of 31 May 2021 is incorporated. A table incorporating
WHO and UK designations and Pango lineages is provided (Table 1);
thereafter variants are referred to using their WHO designation where this
exists, and the UK designation where it does not.
Part 1: Surveillance overview
Variants under surveillance
Table 1 shows the current variants of concern (VOC) and variants under investigation
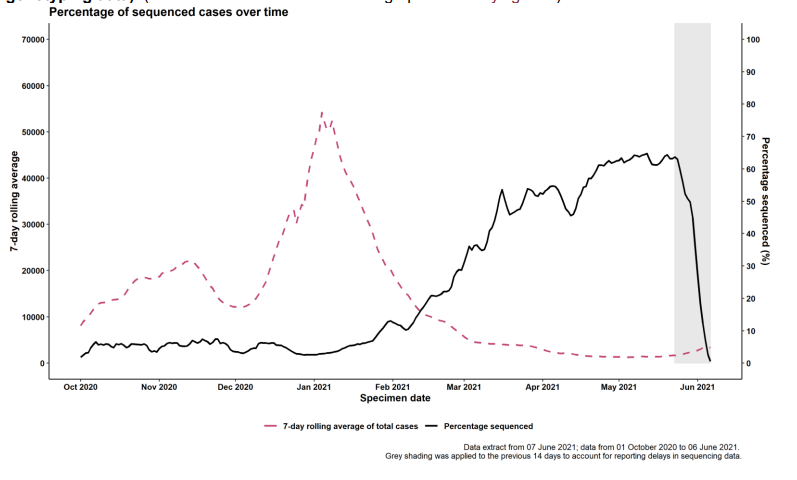
(VUI). Figure 1 shows the proportion of cases sequenced over time. Summary
epidemiology on each variant is shown in Table 4, case numbers are also updated online.
Tables 5 and 6 show hospitalisation and death data. Figure 2 shows cumulative cases of
variants over time.
| WHO nomenclature as of 31 May 2021 | Pangolin Lineage | Designation | First detected in sequence from | Status |
| Alpha | B.1.1.7 | VOC-20DEC01 | UK | VOC |
| Beta | B.1.351 | VOC-20DEC02 | South Africa | VOC |
| Gamma | P.1 | VOC-21JAN02 | Japan ex Brazil | VOC |
| B1.1.7 with E484K | VOC-21FEB02 | UK | VOC | |
| Delta | B.1.617.2 | VOC-21APR02 | India | VOC |
| Zeta | P.2 | VUI-21JAN01 | Brazil | VUI |
| Eta | B.1.525 | VUI-21FEB03 | UK | VUI |
| B.1.1.318 | VUI-21FEB04 | UK | VUI | |
| Theta | P.3 | VUI-21MAR02 | Philippines | VUI |
| Kappa | B.1.617.1 | VUI-21APR01 | India | VUI |
| B.1.617.3 | VUI-21APR03 | India | VUI | |
| AV.1 | VUI-21MAY01 | UK | VUI | |
| C.36.3 | VUI-21MAY02 | Thailand ex Egypt | VUI | |
| Epsilon | B.1.427/B.1.429 | Monitoring | ||
| B.1.1.7 with S494P | Monitoring | |||
| A.27 | Monitoring | |||
| Iota | B.1.526 | Monitoring | ||
| B.1.1.7 with Q677H | Monitoring | |||
| B.1.620 | Monitoring | |||
| B1.214.2 | Monitoring | |||
| B.1.1.1 with L452Q and F490S | Monitoring | |||
| R.1 | Monitoring | |||
| B.1.1.28 with N501T and E484Q | Monitoring | |||
| B.1.621 | Monitoring | |||
| B.1 with 214insQAS | Monitoring | |||
| AT.1 | Monitoring |
VUI-21FEB-01 (A.23.1 with E484K) has not been detected in England since 23 February
2021 and internationally since 17 January 2021. It is designated provisionally extinct and
has been removed from the table.
VOC-21FEB-02 (B.1.1.7 with E484K). This specific clade of B.1.1.7 with E484K has not
been detected in England since 1 March 2021. There is apparent transmission outside the
UK based on international sequence data. It is no longer included in the data update but
monitoring of international data continues.
Sequencing coverage
Figure 1. Coverage of sequencing: percentage of SARS-CoV-2 cases sequenced over time as of 7 June 2021 (excluding
genotyping data).(Find accessible data used in this graph in underlying data)
Use of rapid genotyping
Technical Briefing 15 includes variant diagnoses made both by whole-genome sequencing
and by a genotyping PCR test. Genotyping allows shorter turnaround time (12-24h after
initial confirmation of COVID-19) for a probable variant result. The initial panel of targets
began trials in March 2021, using single nucleotide polymorphisms (SNPs): N501Y,
E484K, K417N and K417T. Results have been reported and used for public health action
since 29 March 2021. On 11 May 2021, after rapid validation of targets to allow
identification of Delta variant, P681R was introduced in the panel to replace N501Y.
Genotyping results have now been fully integrated into the Variant data reports and
analyses. Table 2 shows the categorisation of confirmed and probable variant results
| Test data available | Status | Category in briefing |
| Validated sequencing result (sequenced in any laboratory, but quality assured and variant designated through the national pipeline) | Confirmed | Confirmed (sequencing) |
| Provisional sequencing result (variant designation reported by the sequencing laboratory and not yet processed through the national pipeline) | Probable | Probable (sequencing) |
| Validated sequencing result, processed through the national pipeline but with a low quality genome consistent with the variant | Probable | |
| Genotyping result where sequencing confirmation is awaited or not available | Probable | Probable (genotyping) |
In the week to 5 June 2021, 30,559 samples were processed by all Pillar 2 laboratories
(source: NHS T &T Reflex Assay Programme); 80% of samples (n=24,447) were of
sufficient quality to allow genotyping, giving estimated genotyping coverage of 87.6% of
valid samples in the most recent week. Roll-out of genotyping assay capability continues
in Pillar 2 and Pillar 1 laboratories.
RT-PCR results for each SNP target are recorded in the PHE Second Generation
Surveillance System (SGSS) and a rules-based decision algorithm (RBDA) applied for
distinguishing a variant profile. The RBDA (Table 3) was developed using existing WGS
information and is reviewed weekly using concordance with subsequent confirmed
sequencing of a genotyped sample. During the period 24 May 2021 to 7 June 2021, the
sensitivity and specificity of genotyping for Delta variant was >99% and positive predictive
value was 99.9% when compared with confirmed sequencing.
| Variant | Public Health Manangement Level | Assay mutation profile | ||||
| P681R | N501Y | E484K | K417N | K417T | ||
| Delta*# | 3 | black | green | green | blue | green |
| Beta | 3 | green | orange | orange | black | green |
| Gamma | 2 | green | orange | orange | green | black |
| Undetermined with E484K | 2 | blue | blue | black | blue | blue |
| Undetermined | 1 | All other results | ||||
*Genotyping assay for B.1.617 cannot distinguish between Kappa, Delta and B.1.617.3
and all results are treated as probable Delta given the current dominance of this lineage.
#Delta with K417N will now also be reported. The clade currently present in the UK is
AY.1.
Undeterminedrefers to samples with an assay result but where the pattern of assay gene
target results do not identify 1 of the currently designated variant profiles..
Undetermined with E484Krefers to samples where 1 of the currently designated variant
profiles cannot be assigned but the mutation E484K is detected. This includes some
known VUIs not targeted by the assay and may include other novel variants. All variants
with E484K are notified to public health teams for enhanced action.
VOC and VUI case numbers, proportion, deaths and case fatality rate
Table 4 shows the number of cases and deaths associated with each variant of concern and variant under investigation, and the
proportion of total sequenced cases accounted for by each variant. Table 5 and 6 show the number of cases known to be infected
with variants of concern/variants under investigation who visited an NHS Emergency Department, the number who were admitted,
and the number who died in any setting (note data is shown from 1 February 2021 onwards to enable comparison). Figure 2 shows
the cumulative number of cases per variant indexed by days since first report.
| Variant | Confirmed (sequencing) case number | Probable (sequencing) case number | Probable (genotyping) case number | Total case number | Case Proportion | Deaths | s Case Fatality |
| Alpha | 215,560 | 0 | 5,449* | 221,009 | 86.0% | 4,196 | 1.9%(1.8 to 2.0%) |
| Beta | 858 | 1 | 47 | 906 | 0.4% | 13 | 1.4%(0.8 to 2.4%) |
| Gamma | 154 | 0 | 41 | 195 | 0.1% | 0 | 0.0%(0.0 to 1.9%) |
| VOC-21FEB02 | 45 | 0 | 0 | 45 | 0.0% | 1 | 2.2%(0.1 to 11.8%) |
| Delta# | 17,068 | 0 | 16,139 | 33,207 | 12.9% | 42 | 0.1%(0.1 to 0.2%) |
| Zeta | 54 | 0 | 0 | 54 | 0.0% | 1 | 1.9%(0.0 to 9.9%) |
| VUI-21FEB01 | 79 | 0 | 0 | 79 | 0.0% | 2 | 2.5%(0.3 to 8.8%) |
| Eta | 440 | 0 | 0 | 440 | 0.2% | 12 | 2.7%(1.4 to 4.7%) |
| VUI-21FEB04 | 253 | 0 | 0 | 253 | 0.1% | 1 | 0.4%(0.0 to 2.2%) |
| VUI-21MAR01 | 2 | 0 | 0 | 2 | 0.0% | 0 | 0.0%(0.0 to 84.2%) |
| Theta | 7 | 0 | 0 | 7 | 0.0% | 0 | 0.0%(0.0 to 41.0%) |
| Kappa | 419 | 0 | 0 | 419 | 0.2% | 0 | 0.0%(0.0 to 0.9%) |
| VUI-21APR03 | 13 | 0 | 0 | 13 | 0.0% | 0 | 0.0%(0.0 to 24.7%) |
| VUI-21MAY01 | 143 | 0 | 0 | 143 | 0.1% | 1 | 0.7%(0.0 to 3.8%) |
| VUI-21MAY02 | 122 | 0 | 0 | 122 | 0.0% | 0 | 0.0%(0.0 to 3.0%) |
*Genotyping targets were updated in mid-May 2021 to prioritise accurate identification of Delta over Alpha #Delta includes a high proportion of recent cases who have not completed 28 days of follow up and therefore the 28 day CFR is likely to be an underestimate.
| Variant | Cases since 01 Feb 2021¥ | Cases with specimen date in past 28 days* | Cases with an A&E visit§ (excluding cases with the same specimen and attendance dates)‡ | Cases with an A&E visit§ (including cases with the same specimen and attendance dates) | Cases where presentation to A&E resulted in overnight inpatient admission§ (excluding cases with the same specimen and admission dates)‡ | Cases where presentation to A&E resulted in overnight inpatient admission§ (including cases with the same specimen and admission dates) | Deaths^ | ||||||
| Number | % | Number | % | Number | % | Number | % | Number | % | Number | % | ||
| Alpha | 146,354 | 6,274 | 4.3 | 7,798 | 5.3 | 10,056 | 6.9 | 2,574 | 1.8 | 4,025 | 2.8 | 1,610 | 1.1 |
| Beta | 702 | 44 | 6.3 | 36 | 5.1 | 45 | 6.4 | 10 | 1.4 | 19 | 2.7 | 8 | 1.1 |
| Gamma | 195 | 39 | 20.0 | 7 | 3.6 | 7 | 3.6 | 1 | 0.5 | 1 | 0.5 | 0 | NA |
| VOC21FEB-02 | 17 | 0 | NA | 0 | NA | 0 | NA | 0 | NA | 0 | NA | 1 | 5.9 |
| Delta | 33,206 | 28,738 | 86.5 | 851 | 2.6 | 1,234 | 3.7 | 223 | 0.7 | 383 | 1.2 | 42 | 0.1 |
| Zeta | 24 | 0 | NA | 1 | 4.2 | 1 | 4.2 | 1 | 4.2 | 1 | 4.2 | 0 | NA |
| VUI21FEB-01 | 8 | 0 | NA | 0 | NA | 1 | 12.5 | 0 | NA | 0 | NA | 0 | NA |
| Eta | 386 | 15 | 3.9 | 15 | 3.9 | 19 | 4.9 | 4 | 1.0 | 7 | 1.8 | 6 | 1.6 |
| VUI21FEB-04 | 246 | 35 | 14.2 | 7 | 2.8 | 11 | 4.5 | 1 | 0.4 | 3 | 1.2 | 1 | 0.4 |
| Theta | 7 | 1 | 14.3 | 1 | 14.3 | 1 | 14.3 | 0 | NA | 0 | NA | 0 | NA |
| Kappa | 419 | 19 | 4.5 | 14 | 3.3 | 15 | 3.6 | 2 | 0.5 | 4 | 1.0 | 0 | NA |
| VUI21APR-03 | 13 | 1 | 7.7 | 0 | NA | 0 | NA | 0 | NA | 0 | NA | 0 | NA |
| VUI21MAY-01 | 143 | 55 | 38.5 | 1 | 0.7 | 1 | 0.7 | 0 | NA | 0 | NA | 1 | 0.7 |
| VUI21MAY-02 | 122 | 14 | 11.5 | 6 | 4.9 | 7 | 5.7 | 1 | 0.8 | 2 | 1.6 | 0 | NA |
| Total | Cases with specimen date in past 28 days* | Unlinked | Unvaccinated | < 21 days post dose 1 | ≥21 days post dose 1 | ≥14 days post dose 2 | |
| Delta cases since 1 Feb 2021 ¥ | 33,206 | 28,738 | 4,289 | 19,573 | 2,166 | 5,393 | 1,785 |
| Cases with an A&E visit§ (excluding cases with the same specimen and attendance dates)‡ | 851 | NA | 11 | 567 | 59 | 163 | 51 |
| Cases with an A&E visit§ (including cases with the same specimen and attendance dates) | 1,234 | NA | 16 | 825 | 90 | 220 | 83 |
| Cases where presentation to A&E resulted in overnight inpatient admission§ (excluding cases with the same specimen and admission dates)‡ | 223 | NA | 3 | 146 | 9 | 45 | 20 |
| Cases where presentation to A&E resulted in overnight inpatient admission§ (including cases with the same specimen and admission dates) | 383 | NA | 4 | 251 | 20 | 66 | 42 |
| Deaths^ | 42 | NA | 0 | 23 | 0 | 7 | 12 |
Data sources: Emergency care attendance and admissions from Emergency Care Dataset (ECDS), deaths from PHE daily death data series (deaths within 28 days)
¥ Cases without specimen dates and unlinked sequences (sequenced samples that could not be matched to individuals) are excluded from this table.
* Cases are assessed for any Emergency Care attendance within 28 days of their positive specimen date. Cases still undergoing within 28-day period may
have an emergency care attendance reported at a later date.
§ At least 1 attendance or admission within 28 days of positive specimen date
‡ Cases where specimen date is the same as date of Emergency Care visit are excluded to help remove cases picked up via routine testing in healthcare
settings whose primary cause of attendance is not COVID-19. This underestimates the number of individuals in hospital with COVID-19 but only includes
those who tested positive prior to the day of their Emergency Care visit. Some of the cases detected on the day of admission may have attended for a
diagnosis unrelated to COVID-19.
^ Total deaths in any setting (regardless of hospitalisation status) within 28 days of positive specimen date.
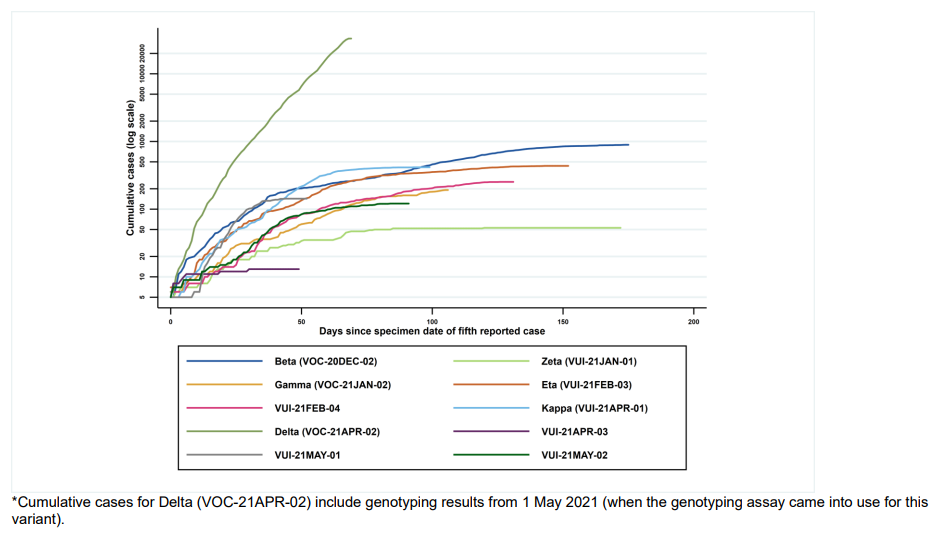
*Cumulative cases for Delta (VOC-21APR-02) include genotyping results from 1 May 2021 (when the genotyping assay came into use for this variant).
Variant prevalence
The prevalence of different variants amongst all sequenced cases and all genotyped and
sequenced cases is presented in Figure 3, split by region in Figure 4 and Figure 5 and by
travel status in Figure 6. The changes in the use of genotyping over time should be
considered when interpreting the prevalence incorporating genotypes. The ‘Other’
category in Figure 3 to 6 includes genomes where the quality is insufficient to determine
variant status and genomes that do not meet the current definition for any designated
variant under investigation or variant of concern. The total dataset used for this
assessment includes enhanced testing and sequencing from individuals who have
travelled, and surge testing and sequencing in outbreak areas. Sequencing numbers and
coverage fall in the last week shown due partly to sequencing lag time, and new
sequences are still being produced relating to sample dates in that week. The
supplementary data for figures are available.
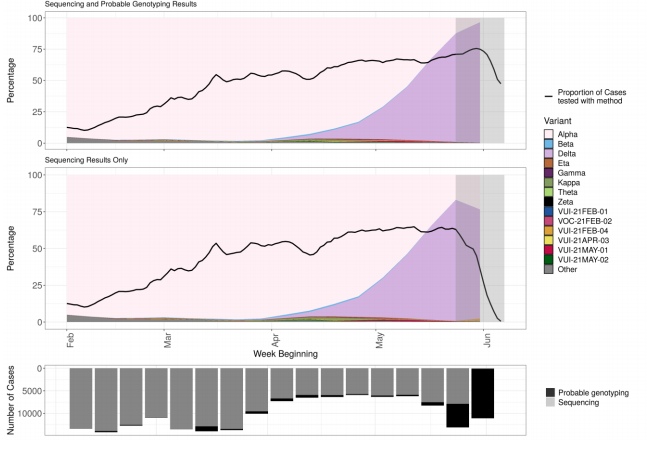
The most recent data show 74% of sequenced cases and 96% of sequenced and
genotyped cases are Delta. At the latest data point where there is complete data (outside
the grey region), 82% of sequenced cases and 86% of sequenced or genotyped cases are
Delta. The black line indicates proportion of cases sequenced in a 7-day rolling window.
The area in grey shows weeks where sequence data are still accumulating, therefore the
proportions are less likely to accurately reflect prevalence. (Find accessible data used in
this graph in underlying data).
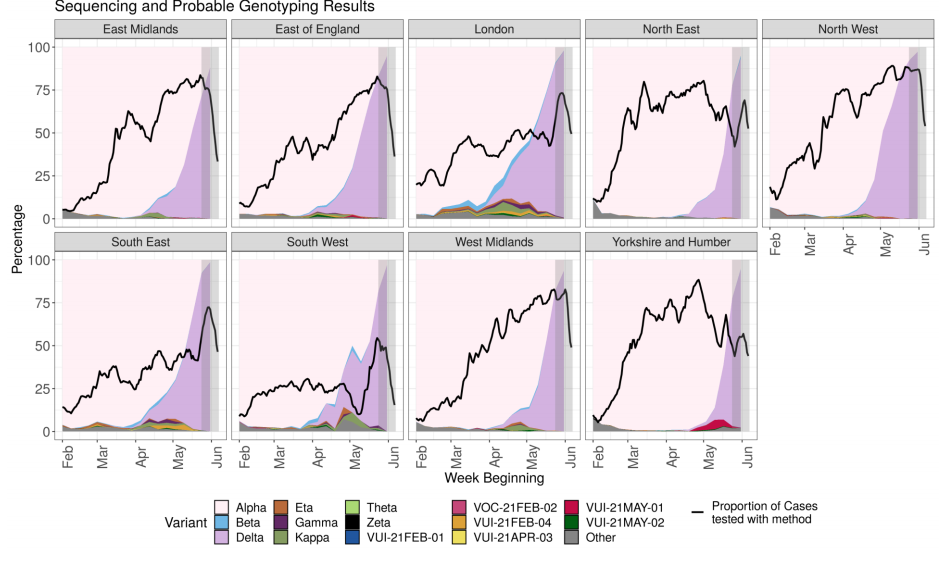
Figure 5. Variant prevalence from 1 February 2021 as of 7 June 2021 by region all sequenced cases in England (excluding 680 cases where the region or specimen date were unknown).
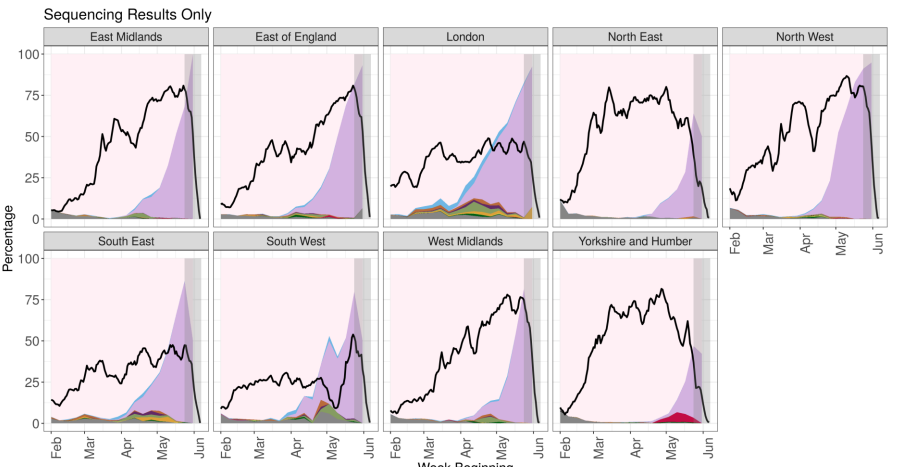
The black line indicates the proportion of cases sequenced in a 7-day sliding window. The
area in grey shows weeks where sequence data are still accumulating, therefore the
proportions are less likely to accurately reflect prevalence. Data for most recent 2 weeks is
incomplete. (Find accessible data used in this graph in underlying data).
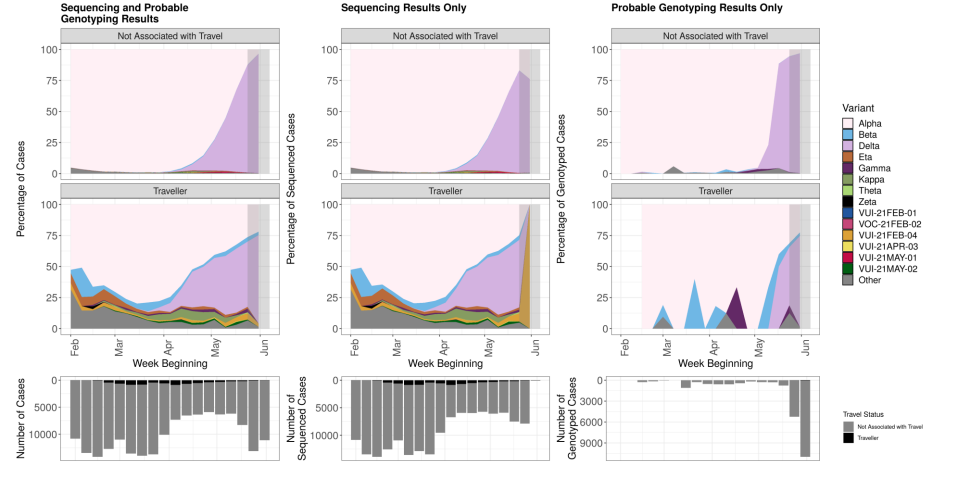
Travel status is assigned based an interval of ≤ 14 days between arrival date and positive
specimen date. Travellers are derived through matching to Passenger Locator Forms,
contact-tracing, international arrivals and local HPT survey data. Where no match to these
datasets was found then the individuals are categorised as not-travel associated. Travel
status was assigned on the basis of the individual's own history of travel, not contact with
a traveller. The area in grey shows weeks where sequence data are still accumulating,
therefore the proportions are less likely to accurately reflect prevalence. The total number
of sequencing and genotyping cases in each week is shown in the bars below, split by
travel status. (Find accessible data used in this graph in underlying data).
Variant Growth rates
Logistic growth rates (1/week from 1 January 2021 as of 7 June 2021) relative to Alpha
are calculated for each variant under investigation or variant of concern with more than 20
samples and shown in Table 7. Sample inclusion criteria are: 1) A non-traveller as
determined by matching each case against passenger locator forms and managed
quarantine service test codes 2) Collected from Pillar 2 testing 3) If multiple sequences are
collected from the same patient which show the same variant, the first sample is retained.
Additionally, samples with missing or unknown date of sample collection or upper tier local
authority (UTLA) of residence are excluded.
In order to adjust for geographic variation in reproduction numbers and sample coverage,
for each VOC/VUI variant under investigation or variant of concern a geographically
matched subsample of Alpha cases is retained for analysis. Alpha cases are subsampled
from each UTLA in proportion to the numbers of each VUI or VOC sampled in that UTLA.
Any Alpha samples collected outside the period of time that the variant under investigation
or variant of concern are observed are excluded as are Alpha samples collected in UTLAs
where the variant under investigation or variant of concern have not yet been detected.
The growth rate is estimated by logistic regression of the variant on time of sample
collection. A growth rate of 0 would indicate parity with Alpha. Growth rate reflects both the
biological properties of the virus and the context (that is population and place) in which it is transmitting.
Compared to Alpha, Delta displays an increased logistic growth rate indicating that the
proportion of samples that are Delta is increasing.
| Variant | Growth rate (1/week) |
| Beta | 0.16 (p=2.106e-38,n=348) |
| Zeta | -0.17 (p=0.01662,n=21) |
| Gamma | 0.34 (p=2.514e-17,n=77) |
| VUI-21FEB-01 | -0.31 (p=0.0009,n=55) |
| Eta | 0.08 (p=7.546e-08,n=194) |
| VUI-21FEB-04 | 0.18 (p=2.221e-18,n=139) |
| Kappa | 0.23 (p=3.074e-14,n=154) |
| Delta | 0.93 (p=0,n=15,495) |
| VUI-21MAY-01 | 0.79 (p=3.244e-29,n=132) |
Sample sizes (n) correspond to the number of variant under investigation or variant of
concern used in the analysis. P values correspond to the null hypothesis that there is no
difference in variant under investigation or variant of growth rates and Alpha growth rates.
Secondary attack rates
This section includes secondary attack rates for traveller and non-traveller cases, and
separate household contact rates. It also includes an updated analysis of time to onset of
symptoms in household contacts.
Secondary attack rates are based on positive tests amongst contacts named to NHS Test
and Trace by an original case identified with a confirmed or probable variant of concern or
variant under investigation. Variant cases are identified using confirmed (sequencing)
results as at 7 June supplemented with probable (genotyping) results as at 8 June, and
exclude LQ-HRG results.
Secondary attack rates are shown for cases with and without travel history. In non-travel
settings, only close contacts (household members, face-to-face contact, people within 1
metre of the case for 1 minute or longer, or people within 2 metres for 15 minutes) named
by the original case are included. In travel settings, the contacts reported are not restricted
to only close contacts named by the case (for example, they may include contacts on a
plane linked by additional contact tracing efforts), leading to likely deflation of secondary
attack rates amongst travellers compared to non-travellers. In addition, people recently
returning from overseas are subject to stricter quarantine measures and may moderate
their behaviour towards contacts. Travel history indicates, but does not confirm, where
infection of the original case occurred.
Table 8 shows the secondary attack rates for Delta compared to the other B.1.617
variants and Alpha. The time period of study for secondary attack rates has been
restricted to the period 29 March 2021 to 19 May 2021, to capture recent social
restrictions and vaccination levels. A reduction in secondary attack rate for non-travel
cases with Alpha is observed in this shorter period when compared to Table 8 covering 05
January 2021 to 19 May 2021.
Secondary attack rates for contacts of cases with Delta and no travel history are higher
than those for contacts of non-travel cases with Alpha: 11.3% compared to 8.0%. The
estimate of secondary attack rate for contacts of cases with Delta represents a second
consecutive decrease compared to previous Technical Briefings. The secondary attack
rates for contacts of cases with Delta for the periods to 29 March to 4 May 2021
(Technical Briefing 13) and 29 March to 11 May 2021 (Technical Briefing 14) were 13.5%
(95% CI 12.5% to 14.6%) and 12.4% (95% CI 11.7% to 13.2%) respectively. Estimates of
secondary attack rates for contacts of those that have travelled with variants of concern or
variants under investigation were all considerably lower than those that have not travelled,
due to the difference in contact definition. Secondary attack rates for contacts of travel
cases with Delta were higher than those for travel cases with Alpha.
Table 9 shows the secondary attack rates for variants (excluding variants of the B.1.617
lineage, that is Delta, Kappa, VUI-21APR-03) for the period 5 January 2021 to 19 May
2021. Secondary attack rates for contacts of non-travel cases with VOC-21FEB-02 and
VUI-21MAY-01 were lower than for contacts of non-travel cases with Alpha over this time.
All other secondary attack rates for contacts of non-travel cases with the remaining
variants of concern or under investigation are not significantly different from Alpha.
Estimates of secondary attack rates for contacts of those that have travelled with variants
of concern or variants under investigation were all considerably lower than those that have
not travelled, due to the difference in contact definition.
Table 10 shows the secondary attack rates amongst household and non-household
contacts of non-travel cases with Delta and Alpha. The time period of study for secondary
attack rates has been restricted to the period 29 March 2021 to 19 May 2021 as in Table
8. Secondary attack rates are higher amongst household contacts than non-household
contacts of non-travel cases with both variants and higher for contacts of non-travel cases
with Delta than Alpha; this is consistent with Table 8.
Figure 7 (and Table 11) shows the time interval between index and secondary case onset
for household contacts, and between exposure date and secondary case onset for nonhousehold
contacts. The median intervals for household and non-household exposures
are 4 days for both Alpha and Delta.
| Variant | Cases in those that have travelled (% with contacts) | Cases in those that have not travelled or unknown (% with contacts) | Case prop ortion that have trav elled | Secondary Attack Rate among contacts of those that have travelled (95% CI) [secondary cases/conta cts] | Secondary Attack Rate among contacts of cases that have not travelled or unknown (95% CI) [secondary cases/contacts] |
| Alpha | 2,042(70.0% with contacts) | 36,812(82.4% with contacts) | 5.3% | 1.5%(1.4% - 1.6%)[510/34,130] | 8.0%(7.8% - 8.2%)[7,801/97,404] |
| Kappa | 185(76.2% with contacts) | 132(80.3% with contacts) | 58.4% | 2.0%(1.6% - 2.6%)[62/3,103] | 10.8%(7.9% - 14.6%)[36/334] |
| Delta | 656(70.6% with contacts) | 8,248(83.9% with contacts) | 7.4% | 2.4%(2.1% - 2.7%)[254/10,756] | 11.3%(10.9% - 11.8%)[2,719/23,971] |
| VUI-21APR-03 | 5(20.0% with contacts) | 5(100.0% with contacts) | 50.0% | Unavailable[0/201] | Unavailable[1/12] |
Secondary attack rates are marked as ‘Unavailable’ when count of contacts is less than 50 or count of exposing cases is less than
20. Travel-linked cases for secondary attack rates are identified positively in NHS Test and Trace data using multiple PHE sources.
A case is considered as being travel-linked if EpiCell or Health Protection Teams have found evidence of international travel, their
NHS Test and Trace record mentions an event associated with international travel, their NHS Test and Trace record was created
after notification via IHR NFP, their contacts were traced by the international contact tracing team or they have been marked for
priority contact tracing in NHS Test and Trace for reasons of travel. Some travel-linked cases may be missed by these methods
and would be marked as non-travel-linked or unknown.
Secondary attack rates from NHS Test and Trace should generally be considered lower
bounds due to the nature of contact tracing and testing. Data provided is for period until 19
May 2021 in order to allow time for contacts to become cases, hence case counts are
lower than other sources. Probable (genotyping) results are included, low quality genomic
results are not.
| Variant | Cases in those that have travelled (% with contacts) | Cases in those that have not travelled or unknown (% with contacts) | Case prop ortion that have trav elled | Secondary Attack Rate among contacts of those that have travelled (95% CI) [secondary cases/conta cts] | Secondary Attack Rate among contacts of cases that have not travelled or unknown (95% CI) [secondary cases/contacts] |
| Alpha | 4,236(76.8% with contacts) | 178,091(75.0% with contacts) | 2.3% | 1.6%(1.5% - 1.7%)[1,237/77,070] | 9.7%(9.6% - 9.8%)[36,808/378,811] |
| Beta | 305(72.1% with contacts) | 384(67.4% with contacts) | 44.3% | 2.2%(1.8% - 2.7%)[104/4,696] | 9.0%(7.2% - 11.1%)[74/825] |
| Zeta | 3(66.7% with contacts) | 29(79.3% with contacts) | 9.4% | Unavailable[0/137] | 8.2%(3.6% - 17.8%)[5/61] |
| Gamma | 65(66.2% with contacts) | 84(75.0% with contacts) | 43.6% | 1.1%(0.6% - 2.1%)[9/802] | 9.9%(6.5% - 14.8%)[20/202] |
| VUI-21FEB-01 | 0(0 with contacts) | 63(60.3% with contacts) | 0.0% | Unavailable[0/0] | 8.6%(4.4% - 16.1%)[8/93] |
| VOC-21FEB-02 | 1(100.0% with contacts) | 34(82.4% with contacts) | 2.9% | Unavailable[0/96] | 1.7%(0.5% - 6.1%)[2/115] |
| Eta | 191(70.2% with contacts) | 193(73.6% with contacts) | 49.7% | 1.2%(0.9% - 1.5%)[47/4072] | 8.5%(6.1% - 11.8%)[32/376] |
| VUI-21FEB-04 | 91(68.1% with contacts) | 136(77.9% with contacts) | 40.1% | 0.6%(0.4% - 0.9%)[16/2,774] | 8.5%(5.9% - 12.0%)[27/319] |
| VUI-21MAR-01 | 1(100.0% with contacts) | 0(0 with contacts) | 100.0% | Unavailable[0/7] | Unavailable[0/0] |
| Theta | 4(25.0% with contacts) | 1(100.0% with contacts) | 80.0% | Unavailable[0/4] | Unavailable[0/3] |
| VUI-21MAY-01 | 2(0.0% with contacts) | 128(87.5% with contacts) | 1.5% | Unavailable[0/0] | 5.9%(4.0% - 8.5%)[25/427] |
| VUI-21MAY-02 | 59(76.3% with contacts) | 45(80.0% with contacts) | 56.7% | 0.9%(0.5% - 1.6%)[11/1248] | 7.8%(4.0% - 14.7%)[8/102] |
Note legend from Table 6. Data provided is for period until 19 May 2021 in order to allow time for contacts to become cases, hence
case counts are lower than other sources. Probable (reflex PCR) results are included, low quality genomic results are not.
| Variant | Cases in those that have not travelled or unknown (with household contacts, with nonhousehold contacts) | Secondary Attack Rate among household contacts of cases that have not travelled or unknown (95% CI) [secondary cases/contacts] | Secondary Attack Rate among nonhousehold contacts of cases that have not travelled or unknown (95% CI) [secondary cases/contacts] |
| Alpha | 36,812 (80.3% with household, 18.1% with non-household contacts) | 8.8% (8.6% - 9.0%) [7,012/79,792] | 4.5% (4.2% - 4.8%) [789/17,612] |
| Delta | 8,248 (82.1% with household, 15.7% with non-household contacts) | 12.3% (11.8% - 12.7%) [2,483/20,253] | 6.3% (5.6% - 7.2%) [236/3,718] |
Note legend from Table 6. Data provided is for period until 19 May 2021 in order to allow time for contacts to become cases, hence
case counts are lower than other sources. Probable (reflex PCR) results are included, low quality genomic results are not.
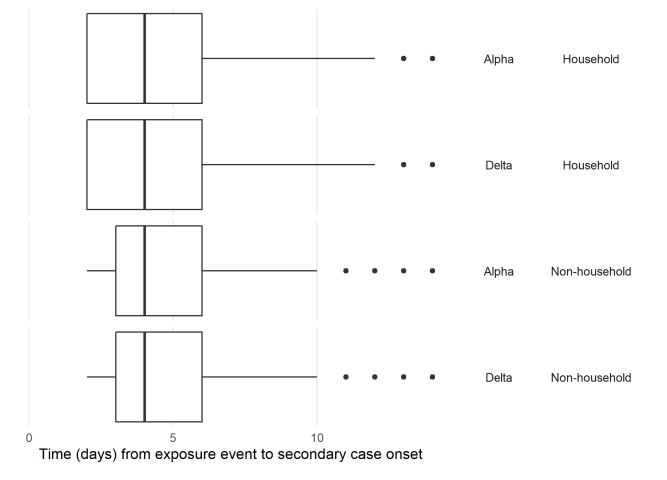
| Variant | Exposure type | Secondary cases | Median interval (days) |
| Alpha | Household | 7,212 | 4 |
| Alpha | Non-household | 1,099 | 4 |
| Delta | Household | 2,592 | 4 |
| Delta | Non-household | 381 | 4 |
NHS Test and Trace data. Distribution of time in days from contact exposure to secondary
case onset of symptoms. Periods restricted to between 2 to 14 days. Household exposure
dates are taken as date of onset or test in primary case. Probable (genotyping) results are
included, low quality genomic results are not.
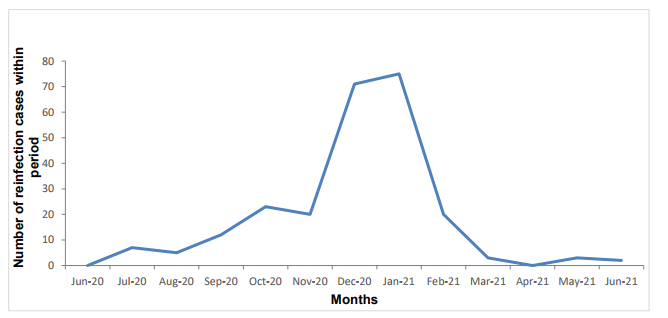
Surveillance of reinfections
The COVID-19 reinfection surveillance programme aims to look at how long immunity
lasts, protection against clinical disease (disease with symptoms) and protection against
more severe disease. It is also important to understand whether those who become
reinfected can pass the virus on to other people.
Individuals who have 2 positive tests (PCR and/or LFD) at least 90 days apart are classed
as possible reinfection cases. A small proportion of reinfections have been sequenced
through standard national surveillance sequencing. Table 12 shows the total number of
sequences available from second episodes of infection in possible reinfection cases,
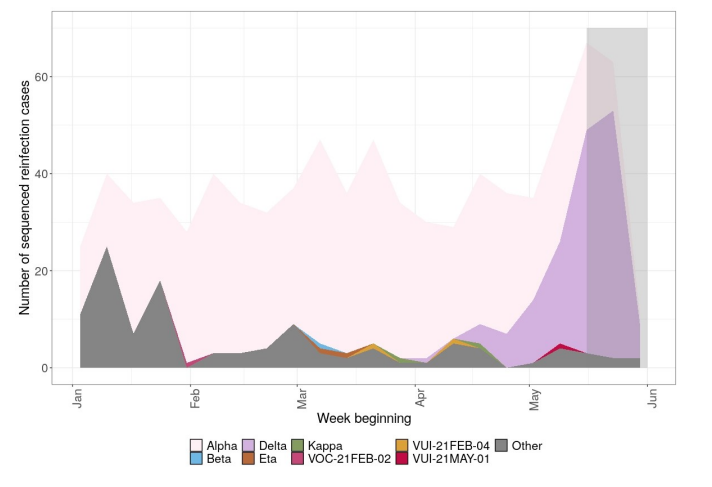
categorized by variant. Figure 8 shows the number of different variants identified through
sequencing that are possible reinfection cases. Sequencing numbers fall in the last 2
weeks shown due partly to sequencing lag time, and new sequences are still being
produced relating to sample dates in those weeks.
| Variant | Total |
| Alpha | 587 |
| Beta | 1 |
| Zeta | 0 |
| VOC-21FEB-02 | 1 |
| Eta | 2 |
| VUI-21FEB-04 | 2 |
| Kappa | 2 |
| Delta | 151 |
| VUI-21APR-03 | 0 |
| VUI-21MAY-01 | 1 |
| VUI-21MAY-02 | 0 |
| Total sequenced | 989 |
Figure 8. The number of reinfections cases from all sample sources, with the total number of reinfections cases with sequences, and the number of variant sequences over time as of 7 June 2021 (Find accessible data used in this graph in underlying data).
SARS-CoV-2 Immunity and Reinfection Evaluation (the SIREN study) cohort monitoring
The SIREN study is a cohort of National Health Service healthcare workers, including 135
sites and 44,549 participants across the UK, 35,714* in England, who remain under active
follow-up with PCR testing every 2 weeks for COVID-19 by PCR. This cohort had a high
seropositivity on recruitment (30% before the second wave) and is now vaccinated (95%).
The incidence of new infections and potential reinfections in SIREN is monitored and
would be expected to rise if a new variant became highly prevalent and was able to
escape predominantly vaccine-derived immunity. During the period of time that Delta
became prevalent, there has been no increase in PCR-positive participants in the SIREN
cohort overall (Figure 9) and reinfections remain at very low numbers in individuals
previously either PCR positive or seropositive (Figure 10). * Number excludes participant
who have withdrawn from the study and requested their data to be removed and any
participant from the devolved administrations
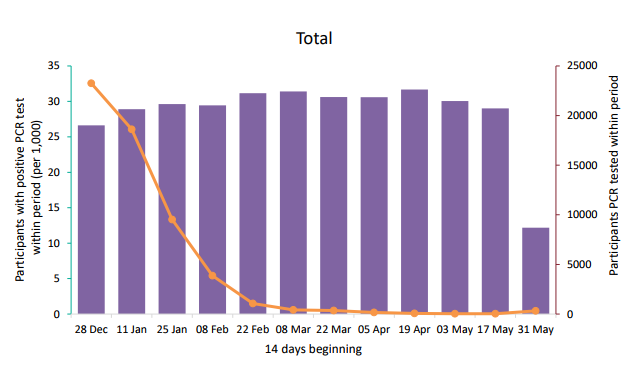
*Contains only participants with at least 1 PCR test within given period; participants are
counted as positive if at least 1 PCR test within given period is positive. Figures have not
been restricted by antibody status nor vaccination status; includes only participants from
England trusts.
.
Nine thousand, eight hundred and thirteen (31%) of the SIREN cohort had evidence of
prior infection (previous PCR positive or antibody positive) at enrolment. This number has
increased during follow-up as participants move from the negative to positive cohort after
a primary infection. There have been 241 potential reinfections (blue line) identified in
England up to 6 June 2021. This is provisional data as potential reinfection cases flagged
are undergoing further investigation, and some may subsequently be excluded.
Variants linked to suspected SARS-CoV-2 outbreaks
Data on all new acute respiratory infection (ARI) incidents reported to Health Protection
Teams (HPTs) and entered on the Case and Incident Management System (CIMS) in the
previous reporting week are published in the weekly influenza/COVID-19 surveillance
report.
Here we present information on a subset of these incidents – those suspected
SARS-CoV-2 clusters and outbreaks that have at least 1 confirmed non-Alpha
variant of concern or variant under investigation case identified and linked to them.
Incidents are assigned a variant type through an automated data linkage process
which brings together incident data, case data and genomics data. These are
experimental data as the methodology is new and will continue to undergo further
validation and enhancements. Alpha-related incidents are not included here because
these outbreaks have not been recorded in an equivalent way during the period that
this was the dominant strain and an accurate comparison cannot be made.
It is important to note that there is a time lag from the suspected outbreak being reported
to PHE to genotyping and sequencing being undertaken and variant cases identified so
data are provisional and likely to change in subsequent weeks.
Note that:
• an incident is an administrative record regarding a setting rather than an
epidemiological classification and consequently complex, multi-variant incidents
exist in a given setting
• household outbreaks and clusters that have been misclassified as outbreaks
linked to settings are excluded
• suspected Alpha outbreaks and clusters are excluded
• supplementary data on Table 13, 14 and 15 are available in underlying data.
• the incidents captured on the CIMS represent a subset of all ongoing clusters
and outbreaks in England – a variety of arrangements are in place with local
authorities and other stakeholders supporting HPTs, however, data may not
routinely be documented on the CIMS
| Setting/YearWeek | 21-01 | 21-02 | 21-03 | 21-04 | 21-05 | 21-06 | 21-07 | 21-08 | 21-09 | 21-10 | 21-11 | 21-12 | 21-13 | 21-14 | 21-15 | 21-16 | 21-17 | 21-18 | 21-19 | 21-20 | 21-21 | 21-22 | Total |
| Custodial Institution | 0 | 0 | 0 | 1 | 0 | 0 | 0 | 0 | 0 | 0 | 0 | 0 | 0 | 0 | 0 | 0 | 0 | 0 | 0 | 1 | 0 | 1 | 3 |
| Food Outlet/Restaurant | 0 | 0 | 0 | 0 | 0 | 0 | 0 | 0 | 0 | 0 | 0 | 0 | 0 | 0 | 0 | 0 | 0 | 1 | 1 | 4 | 3 | 3 | 12 |
| Healthcare | 0 | 2 | 1 | 1 | 1 | 0 | 0 | 1 | 1 | 0 | 1 | 0 | 0 | 0 | 0 | 2 | 1 | 2 | 1 | 2 | 1 | 1 | 18 |
| Care Home | 2 | 1 | 1 | 1 | 2 | 2 | 0 | 1 | 0 | 0 | 0 | 0 | 0 | 1 | 0 | 1 | 1 | 0 | 0 | 2 | 7 | 3 | 25 |
| Workplace | 2 | 1 | 1 | 3 | 2 | 1 | 1 | 1 | 0 | 0 | 2 | 0 | 0 | 2 | 0 | 2 | 5 | 4 | 10 | 25 | 25 | 15 | 102 |
| Educational Setting | 0 | 0 | 0 | 0 | 0 | 0 | 1 | 1 | 0 | 0 | 2 | 1 | 2 | 2 | 1 | 3 | 9 | 20 | 24 | 50 | 84 | 71 | 271 |
| Other | 0 | 1 | 1 | 5 | 5 | 5 | 2 | 4 | 2 | 2 | 4 | 0 | 7 | 14 | 5 | 13 | 30 | 51 | 30 | 47 | 37 | 28 | 293 |
| Total | 4 | 5 | 4 | 11 | 10 | 8 | 4 | 8 | 3 | 2 | 9 | 1 | 9 | 19 | 6 | 21 | 46 | 78 | 66 | 131 | 157 | 122 | 724 |
| Variant/Week | 21-01 | 21-02 | 21-03 | 21-04 | 21-05 | 21-06 | 21-07 | 21-08 | 21-09 | 21-10 | 21-11 | 21-12 | 21-13 | 21-14 | 21-15 | 21-16 | 21-17 | 21-18 | 21-19 | 21-20 | 21-21 | 21-22 | Total |
| Beta | 0 | 0 | 0 | 3 | 3 | 2 | 2 | 1 | 2 | 1 | 2 | 0 | 2 | 9 | 3 | 3 | 5 | 3 | 3 | 0 | 3 | 1 | 48 |
| VOC-20DEC01+E484K | 0 | 0 | 0 | 0 | 0 | 0 | 0 | 0 | 0 | 0 | 0 | 0 | 1 | 2 | 0 | 1 | 1 | 0 | 0 | 0 | 0 | 0 | 5 |
| Zeta | 0 | 1 | 2 | 1 | 0 | 1 | 0 | 3 | 0 | 0 | 0 | 0 | 0 | 0 | 0 | 0 | 0 | 0 | 0 | 0 | 0 | 0 | 8 |
| Gamma | 0 | 1 | 0 | 0 | 0 | 0 | 0 | 1 | 0 | 0 | 0 | 0 | 0 | 1 | 0 | 2 | 4 | 3 | 0 | 0 | 1 | 5 | 18 |
| VUI-21FEB-01 | 1 | 0 | 0 | 1 | 0 | 0 | 0 | 0 | 0 | 0 | 0 | 0 | 0 | 0 | 0 | 0 | 0 | 0 | 0 | 0 | 0 | 0 | 2 |
| Eta | 0 | 0 | 0 | 0 | 4 | 1 | 1 | 1 | 0 | 0 | 4 | 0 | 3 | 1 | 1 | 3 | 1 | 0 | 1 | 0 | 1 | 0 | 22 |
| VUI-21FEB-04 | 0 | 0 | 0 | 0 | 0 | 0 | 0 | 0 | 1 | 0 | 0 | 0 | 0 | 1 | 1 | 1 | 0 | 0 | 1 | 0 | 1 | 0 | 6 |
| VOC-21FEB-02 | 1 | 1 | 1 | 1 | 2 | 3 | 0 | 2 | 0 | 1 | 0 | 0 | 0 | 0 | 0 | 0 | 0 | 0 | 0 | 0 | 0 | 0 | 12 |
| VUI-21MAR-01 | 0 | 0 | 0 | 0 | 1 | 0 | 0 | 0 | 0 | 0 | 0 | 0 | 0 | 0 | 0 | 0 | 0 | 0 | 0 | 0 | 0 | 0 | 1 |
| VUI-21APR-01 | 0 | 0 | 0 | 0 | 0 | 0 | 1 | 0 | 0 | 0 | 0 | 0 | 0 | 0 | 1 | 3 | 5 | 9 | 2 | 0 | 2 | 3 | 26 |
| Delta | 1 | 0 | 0 | 1 | 0 | 0 | 0 | 0 | 0 | 0 | 0 | 0 | 0 | 2 | 0 | 7 | 21 | 59 | 53 | 122 | 134 | 91 | 491 |
| VUI-21APR-03 | 0 | 0 | 0 | 0 | 0 | 0 | 0 | 0 | 0 | 0 | 2 | 0 | 0 | 0 | 0 | 0 | 0 | 0 | 0 | 0 | 0 | 0 | 2 |
| VUI-21MAY-01 | 0 | 0 | 0 | 0 | 0 | 0 | 0 | 0 | 0 | 0 | 0 | 0 | 0 | 1 | 0 | 0 | 0 | 0 | 0 | 2 | 1 | 0 | 4 |
| Undetermined+E 484K | 0 | 0 | 0 | 0 | 0 | 0 | 0 | 0 | 0 | 0 | 0 | 0 | 0 | 1 | 0 | 0 | 1 | 0 | 0 | 1 | 0 | 0 | 3 |
| Unclassified | 0 | 0 | 0 | 0 | 0 | 0 | 0 | 0 | 0 | 0 | 0 | 0 | 2 | 0 | 0 | 0 | 1 | 1 | 0 | 2 | 3 | 2 | 11 |
| Multiple Variants identified | 1 | 2 | 1 | 4 | 0 | 1 | 0 | 0 | 0 | 0 | 1 | 1 | 1 | 1 | 0 | 1 | 7 | 3 | 6 | 4 | 11 | 20 | 65 |
| Total | 4 | 5 | 4 | 11 | 10 | 8 | 4 | 8 | 3 | 2 | 9 | 1 | 9 | 19 | 6 | 21 | 46 | 78 | 66 | 131 | 157 | 122 | 724 |
| Variant | Care Home | Custodial Institution | Educational Setting | Food outlet/restaurant | Healthcare | Other | Workplace | Total |
| Beta | 1 | 1 | 5 | 1 | 4 | 31 | 5 | 48 |
| VOC-20DEC01+E484K | 0 | 0 | 2 | 0 | 0 | 3 | 0 | 5 |
| Zeta | 0 | 0 | 0 | 0 | 1 | 6 | 1 | 8 |
| Gamma | 1 | 0 | 6 | 1 | 0 | 9 | 1 | 18 |
| VUI-21FEB-01 | 0 | 0 | 0 | 0 | 0 | 0 | 2 | 2 |
| Eta | 3 | 0 | 4 | 0 | 3 | 11 | 1 | 22 |
| VUI-21FEB-04 | 0 | 0 | 3 | 0 | 0 | 2 | 1 | 6 |
| VOC-21FEB-02 | 3 | 0 | 1 | 0 | 0 | 5 | 3 | 12 |
| VUI-21MAR-01 | 0 | 0 | 0 | 0 | 0 | 1 | 0 | 1 |
| VUI-21APR-01 | 0 | 0 | 6 | 0 | 0 | 20 | 0 | 26 |
| Delta | 15 | 2 | 217 | 8 | 5 | 169 | 75 | 491 |
| VUI-21APR-03 | 0 | 0 | 0 | 0 | 0 | 2 | 0 | 2 |
| VUI-21MAY-01 | 0 | 0 | 1 | 0 | 0 | 2 | 1 | 4 |
| Undetermined+E484K | 0 | 0 | 1 | 0 | 0 | 2 | 0 | 3 |
| Unclassified | 1 | 0 | 5 | 0 | 0 | 2 | 3 | 11 |
| Multiple variants identified | 1 | 0 | 20 | 2 | 5 | 28 | 9 | 65 |
| Total | 25 | 3 | 271 | 12 | 18 | 293 | 102 | 724 |
Suspected clusters and outbreaks linked to primary and secondary schools (including
Special Educational Needs (SEN) settings) undergo further validation. Individual incident
and case notes are reviewed by an epidemiologist on a weekly basis and an assessment
made about whether the criteria for a confirmed SARS-CoV-2 cluster or outbreak are met.
In the most recent 4 week period there have been 144 confirmed SARS-CoV-2 outbreaks
linked to primary and secondary schools that have had at least 1 variant case linked to
them. This represents around 0.6% of all schools.
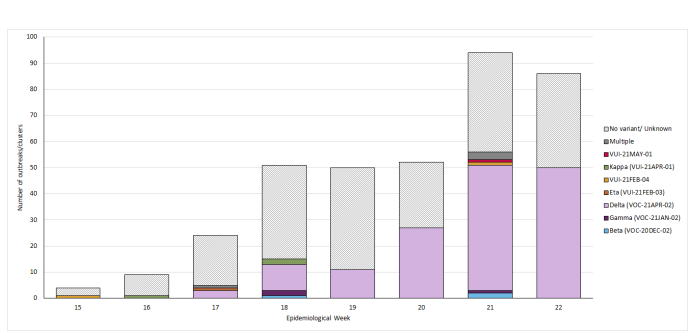
| Variant/Week | 21-15 | 21-16 | 21-17 | 21-18 | 21-19 | 21-20 | 21-21 | 21-22 | Total |
| Beta | 1 | 2 | 3 | ||||||
| Gamma | 2 | 1 | 3 | ||||||
| Delta | 3 | 10 | 11 | 27 | 48 | 50 | 149 | ||
| Eta | 1 | 1 | |||||||
| VUI-21FEB-04 | 1 | 1 | 2 | ||||||
| Kappa | 1 | 2 | 3 | ||||||
| VUI-21MAY-01 | 1 | 3 | 4 | ||||||
| Multiple | 1 | 3 | 4 | ||||||
| No variant/Unknown | 3 | 8 | 19 | 36 | 39 | 25 | 38 | 36 | 204 |
| Total | 4 | 9 | 24 | 51 | 50 | 52 | 94 | 86 | 370 |
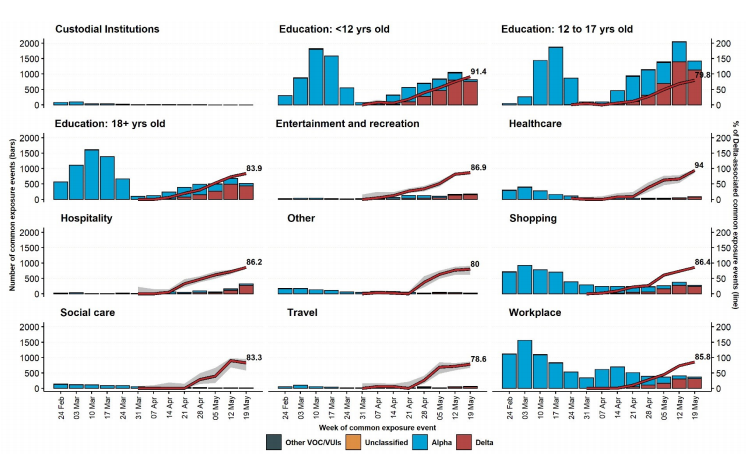
Common exposures derived from contact tracing data
Figure 12 shows the number of common exposure events reported per week, by setting,
from 24 February to 25 May 2021. This figure only includes common exposures reported
during contact tracing by cases who have been sequenced, to enable a comparison of
trends by variant. Common exposures are derived from contact tracing data and are
defined as specific venues visited outside the home by at least 2 cases during their presymptomatic
period (2 to 7 days before symptom onset), on the same day or up to 7 days
apart. A single common exposure event represents a visit by a case on a particular day to
the common exposure setting.
Common exposure events may represent transmission events between known cases but
also from unknown cases. However, they can also simply represent commonly visited
locations and so should be interpreted with caution. Settings visited regularly (for example
daily school or workplace attendance), can be enhanced in the data as each of the
separate visits are counted. Fewer common exposures occur when settings are closed or
limited due to restrictions, so should be interpreted in the context of national policy as well
as other events such as school holiday periods.
The most frequently reported settings for common exposures were education and
workplace. In the latest week presented (from 19 May 2021), secondary school education
settings were the most frequent common exposure. Most settings have low total numbers
of events reported. The number and proportion of common exposure events linked
specifically to Delta cases (red bar and line respectively in Figure 12) has increased over
time, reflecting the overall increase in Delta prevalence.
Part 2: Delta (B.1.617.2) surveillance
The lineage B.1.617.2 was escalated to a variant of concern in the UK on 6 May 2021
(VOC-21APR-02). This variant was named Delta by WHO on 31 May 2021.
Transmissibility
PHE has undertaken a pair-matched case-control study to estimate the odds of household
transmission for Delta index cases compared with Alpha SARS-CoV-2 index cases. The
analysis included 3,765 genomically sequenced index cases in residential clusters (index
case followed by 1 or more laboratory confirmed SARS-CoV-2 cases at the same private
dwelling) were matched to 7,530 sporadic cases (cases with no SARS-CoV-2 cases in the
household in the subsequent 14 days) as controls. Matching was undertaken on lower-tier
local authority of residence, fortnight of positive test and property type.
A logistic regression model adjusting for age, sex, ethnicity, index of multiple deprivation
and vaccination status of the index case showed the adjusted odds of household
clustering was 1.64 (95%CI 1.26-2.13, p < 0.001) among those with Delta variant
compared to those Alpha variant. These preliminary findings suggest that the Delta variant
may be more strongly associated with household transmission compared to Alpha variant
and should be considered in the context of other analytical methods assessing
transmissibility of this variant.
The full analysis can be found at Increased Household Transmission of COVID-19 Cases Associated with SARS-CoV-2 Variant of Concern B.1.617.2: A national case-control study
| Unadjusted Odds Ratio (95% CI) | P value | Adjusted Odds* (95% CI) | P value | |
| Delta household transmission | 1.66(1.28-2.14) | < 0.001 | 1.64(1.26-2.13) | < 0.001 |
*Adjusted for sex, age, ethnicity, deprivation of residence (IMD), vaccination status of index case
Severity
Complementary analyses undertaken in England and Scotland found an increased risk of
hospitalisation in cases who were S gene target positive (Scotland) or had sequenceconfirmed
Delta variant infection (England). Confirmatory analyses are required to confirm
the magnitude of the change in risk and to explore the link to vaccination in more detail.
England
Based on a record linkage of sequence-confirmed Delta and Alpha cases in England
tested between 29 March 2021 and 23 May 2021 and with hospitalisation data up until 5
June 2021, a preliminary analysis of 43,338 sequenced cases was performed to assess
the risk of hospitalisation and emergency care attendance. Using stratified Cox
proportional hazard regression, there was a significantly increased risk of hospitalisation
within 14 days of specimen date (HR 2.26, 95% CI 1.32-3.89, p=0.003), and emergency
care attendance or hospitalisation within 14 days (HR 1.45,95% CI 1.08-1.95, p=0.015),
for Delta cases compared to Alpha cases after adjustment for confounders (age, sex,
ethnicity, area of residence, index of multiple deprivation, week of specimen date,
vaccination status and international travel within 14 days prior to specimen date).
Scotland
In the Public Health Scotland/EAVE II study, Cox proportional hazard regression was used
to estimate risk factors for the time from test to hospitalisation among individuals who
tested positive. Hospitalisation with COVID-19 was defined as any admission within 14
days of a positive test or where there was a positive test within 2 days of admission. The
model was adjusted for age and days from 1 April 2021 as spline terms together with
number of co morbid conditions, gender and vaccination status. Vaccination status was
determined at the data of the PCR test. Only individual who tested positive from 1 April
2021 onwards (until 6 June 2021) were included in this analysis. There was an increased
hazard ratio of hospitalisation for those who were S-gene positive compared with those
with S gene target failure (1.85, 95% 1.39 to 2.47).
Monitoring of vaccine effectiveness
Analysis of routine testing data linked to sequencing and S-gene target status has been
used to estimate vaccine effectiveness against symptomatic disease, methods are
described in Effectiveness of COVID-19 vaccines against the Delta variant. After a single
dose there was a 17% absolute reduction in vaccine effectiveness against symptomatic
disease with Delta compared to Alpha, but only a modest reduction in vaccine
effectiveness after 2 doses (Table 18).
| Vaccination status | Vaccine Effectiveness | |
| Alpha | Delta | |
| Dose 1 | 50.2 (46.7 to 53.5) | 33.2 (25.8 to 39.9) |
| Dose 2 | 88.4 (85.7 to 90.7) | 80.8 (76.3 to 84.4) |
International surveillance
GISAID includes data on sequences available internationally. As of 7 June 2021,
sequences from the following countries (excluding UK) have been identified in GISAID of
Delta: In total 6,653 sequences from: Anguilla, 1, Argentina, 1, Aruba, 3, Australia, 136,
Austria, 5, Bahrain, 14, Bangladesh, 42, Belgium, 181, Brazil, 1, Bulgaria, 1, Canada, 125,
China, 2, Czech Republic, 9, Democratic Republic of the Congo, 6, Denmark, 91, France,
76, Georgia, 4, Germany, 499, Ghana, 1, Greece, 3, Hong Kong, 3, India, 2367,
Indonesia, 27, Iran, 9, Ireland, 128, Israel, 37, Italy, 111, Japan, 154, Jordan, 1,
Luxembourg, 52, Malaysia, 11, Malta, 1, Mexico, 22, Morocco, 1, Nepal, 12, Netherlands,
48, New Zealand, 13, Norway, 42, Pakistan, 1, Poland, 50, Portugal, 73, Qatar, 26,
Reunion, 1, Romania, 5, Russia, 82, Saint Martin, 1, Singapore, 232, Slovenia, 1, South
Africa, 16, South Korea, 1, Spain, 98, Sweden, 36, Switzerland, 62, Thailand, 88, Turkey,
1, USA, 1630, Uganda, 3, Vietnam, 6.
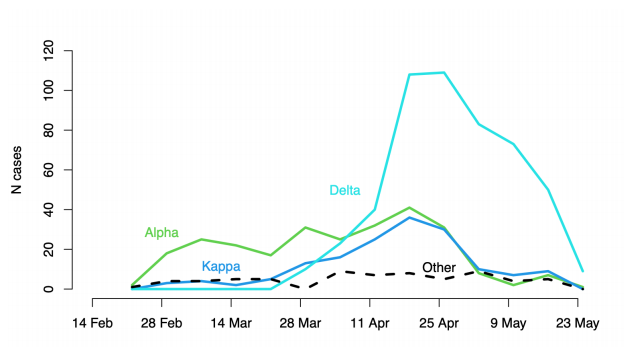
Each line shows the count of cases by test date of that lineage with known travel history
from India within 14 days of testing positive: Alpha in green, Kappa in blue, Delta in cyan,
other lineages as dashed line (22 February 2021 to 30 May 2021, final week incomplete).
(Find accessible data used in this graph in underlying data).
Surveillance through genomic data
| Variant | Confirmed (sequencing) case number | Probable (genotyping PCR) case number | Total case number | Case Proportion1 | Cases that have confirmed travel | Proportion of confirmed travellers among cases |
| East Midlands | 1,318 | 508 | 1,826 | 5.5% | 75 | 4.1% |
| East of England | 1,799 | 632 | 2,431 | 7.3% | 92 | 3.8% |
| London | 2,325 | 2,761 | 5,086 | 15.3% | 280 | 5.5% |
| North East | 246 | 636 | 882 | 2.7% | 13 | 1.5% |
| North West | 8,288 | 6,704 | 14,992 | 45.1% | 56 | 0.4% |
| South East | 1,114 | 1,755 | 2,869 | 8.6% | 115 | 4% |
| South West | 306 | 158 | 464 | 1.4% | 54 | 11.6% |
| West Midlands | 1,112 | 1,109 | 2,221 | 6.7% | 75 | 3.4% |
| Yorkshire and Humber | 476 | 1,828 | 2,304 | 6.9% | 29 | 1.3% |
| Unknown region | 84 | 48 | 132 | 0.4% | 21 | 15.9% |
| Total | 17,068 | 16,139 | 33,207 | - | 810 | 2.4% |
1Calculated as a proportion of all cases, including those with unknown or pending travel status. As of 7 June 2021 30.5 % cases with Delta variant had confirmed links to travel, identified through passenger locator forms, contact tracing or enhanced tracing interviews.
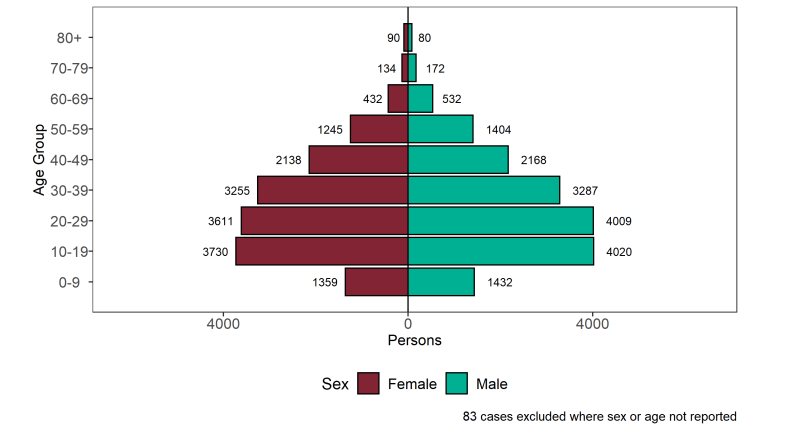
Figure 15. Confirmed (sequencing) and probable (genotyping) Delta cases by specimen date and detection method as of 7 June 2021(Find accessible data used in this graph in underlying data).
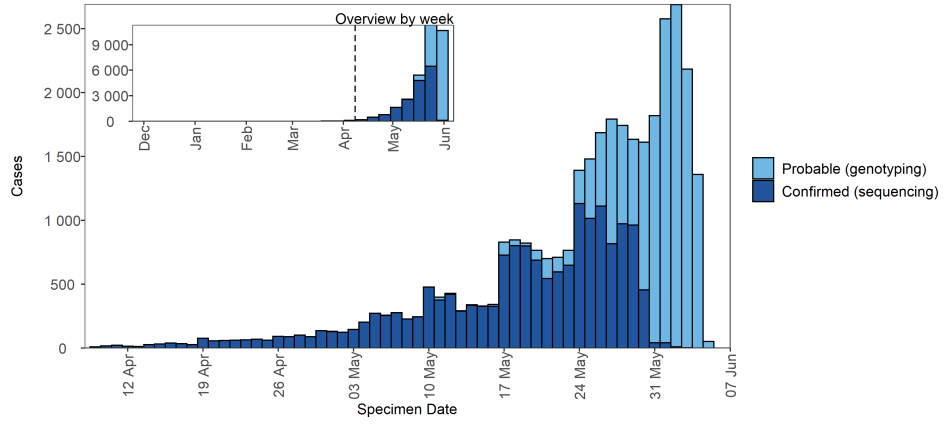
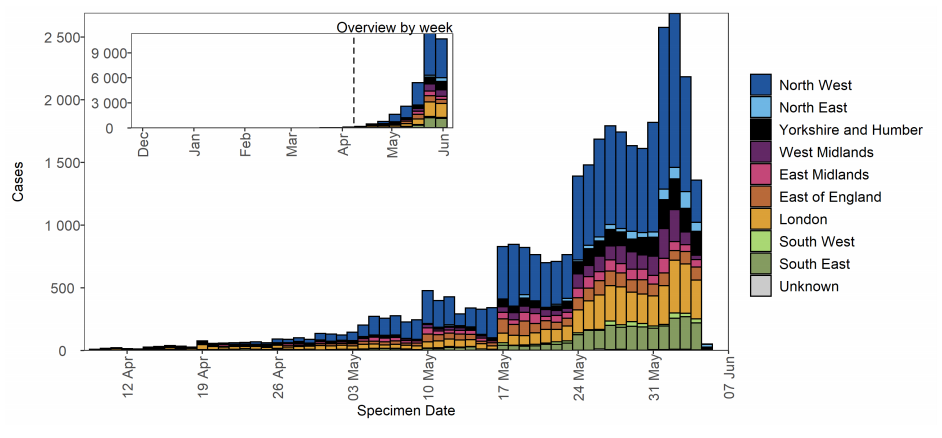
Figure 16. Confirmed (sequencing) and probable (genotyping) Delta cases by specimen date and region of residence as of 7 June 2021 Larger plot includes last 60 days only.(Find accessible data used in this graph in underlying data).
| Amino acid change | Nucleotide change | Total number of sequences (UK) | Number of unlinked sequences | Number of sequences 9 March to 8 April 2021 | Number of sequences 9 April to 8 May 2021 | Number of sequences 9 May to 8 June 2021 |
| P681R | C23604G | 23,670 | 3,919 | 86 | 3,113 | 16,552 |
| L452R | T22917G | 23,247 | 3,851 | 87 | 3,076 | 16,233 |
| G142D | G21987A | 16,494 | 2,663 | 62 | 1,873 | 11,896 |
| R158G | A22034G | 75 | 4 | 0 | 0 | 71 |
| G446V | G22899T | 47 | 32 | 0 | 1 | 14 |
| K417N | G22813T | 45 | 8 | 0 | 16 | 21 |
| Q677H | G23593T | 13 | 0 | 3 | 6 | 4 |
| V503I | G23069A | 9 | 1 | 0 | 0 | 8 |
| L244S | T22293C | 8 | 2 | 0 | 1 | 5 |
| S255F | C22326T | 6 | 0 | 0 | 4 | 2 |
| S494L | C23043T | 4 | 0 | 0 | 0 | 4 |
| E484A | A23013C | 4 | 0 | 0 | 4 | 0 |
| D215G | A22206G | 3 | 0 | 0 | 0 | 3 |
| S494A | T23042G | 3 | 0 | 0 | 0 | 3 |
| L18F | C21614T | 3 | 1 | 0 | 0 | 2 |
| S477I | G22992T | 2 | 0 | 0 | 0 | 2 |
| P479S | C22997T | 2 | 0 | 0 | 0 | 2 |
| D405Y | G22775T | 2 | 2 | 0 | 0 | 0 |
| A701V | C23664T | 2 | 1 | 0 | 1 | 0 |
This data uses the numbers of genomes in the national genomic dataset rather than case
numbers. Unlinked sequences refers to genomes which have not been linked to a primary
PCR result in the English database and include individuals from outside of England.
Further investigations of K417N genomes are being undertaken.
Surveillance through S gene detection
The S gene target in a 3-target assay (S, N and ORF1ab) used in some Lighthouse
Laboratories is not detected in Alpha. However, this S gene is detected in Kappa, Delta
and VUI-21APR-03 (B.1.617.3) variants. It is also detected in Beta and other variants.
Specimens with a detectable S gene (also referred to as S gene positive) are defined as
those with cycle threshold (CT) values of ≤30 in all 3 gene targets: S, N, and ORF1ab.
Figure 17 shows the number of sequenced S gene positive isolates over time since
January 2021 (data as of 8 June 2021), as well as the distribution of identified variants
among these specimens. Unclassified variants refer to those not currently considered a
variant of concern or variant under investigation; these dominated the sequenced S gene
positive specimens at the beginning of 2021 and have decreased to less than 1% since
the end of April 2021. The proportion of confirmed Delta specimens among S gene
positives continues to increase, and has been above 95% in the most recent 3 weeks of
data (since 11 May 2021). In the most recent week of data (starting 25 May 2021), this
proportion has been more than 99% across all regions except for the South West, an area
with few cases detected with the TaqPath assay (Figures 18 and 19).
The number and proportion of S gene positive samples in England (Figure 20) has also
steadily increased since mid-April, with 15,817 cases reported in the week starting 1 June;
91.6% of all cases tested on the TaqPath assay and reported to PHE that week. All
regions now have majority S gene positive cases in the most recent week (Figure 21), but
with local authorities in the North West continuing to stand out in terms of numbers of S
gene positives (Figures 18 and 22).
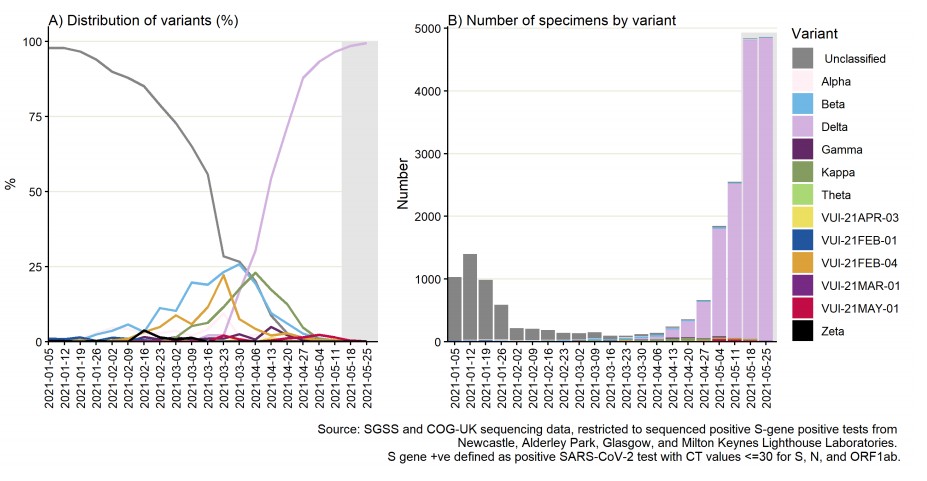
Figure 18. Weekly distribution of variants among sequenced S gene positive SARS-CoV-2 specimens, by region of residence.Black line represents weekly proportion of specimens that are Delta with most recent 2 weeks labelled and 95% confidence intervals in lilac. Proportions for other variants not shown but are grouped for counts (bars). Specimen dates between 2 March 2021 and 31 May 2021, data as of 8 June 2021. Gray shading applied to 14 most recent days of data as these are affected by reporting delay. (Find accessible data used in this graph in underlying data).
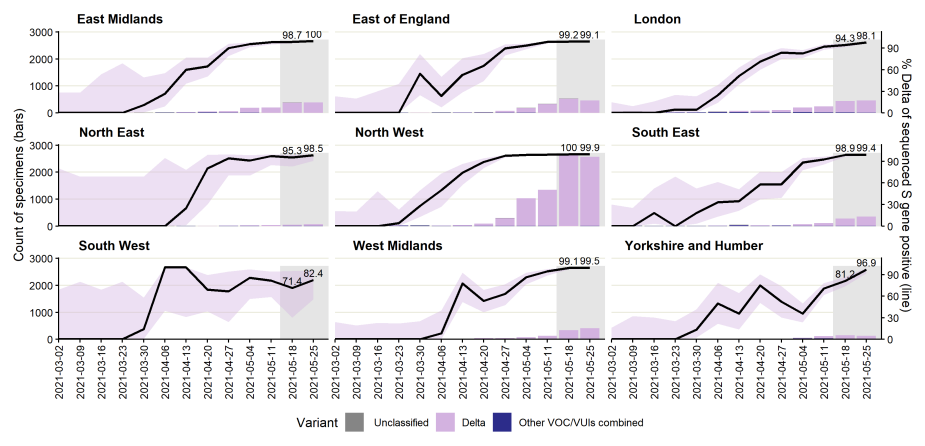
Figure 19. Number of cases with detectable S gene target and TaqPath lab test coverage by local authority of residenceSpecimen dates from 29 May 2021 to 4 June 2021, data as of 8 June 2021; most recent 3 days excluded to reporting delay (Find accessible data used in this graph in underlying data)
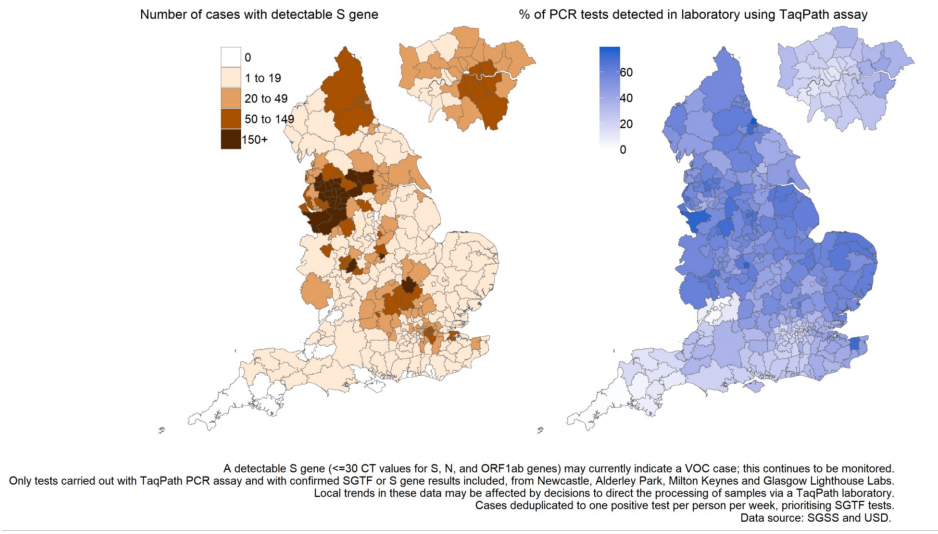
Figure 20. Weekly number and proportion of England Pillar 2 COVID-19 cases with SGTF and detectable S gene target among those tested with the TaqPath assay Specimen dates between 1 September 2020 to 7 June 2021, data as of 8 June 2021. (Find accessible data used in this graph in underlying data).
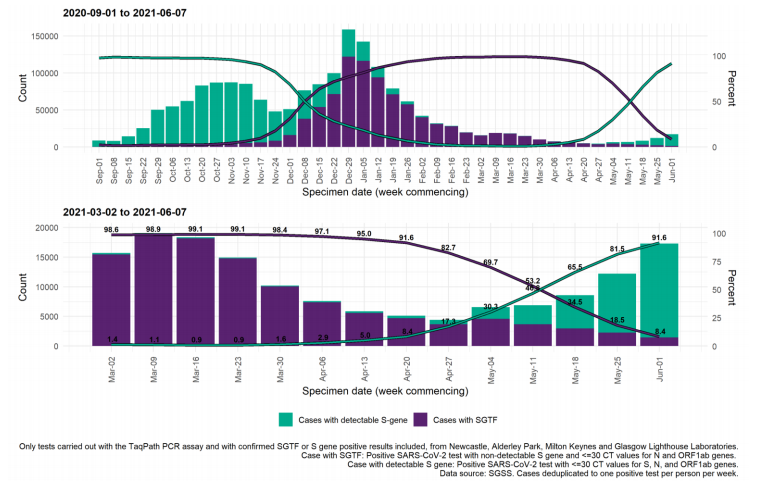
Figure 21. Weekly number and proportion of England Pillar 2 COVID-19 cases with detectable S gene target or SGTF among those tested with the TaqPath assay, by region of residence. 2021, data as of 8 June 2021; 95% confidence intervals indicated by grey shading and percentage for most recent week labelled (Find accessible data used in this graph in underlying data).
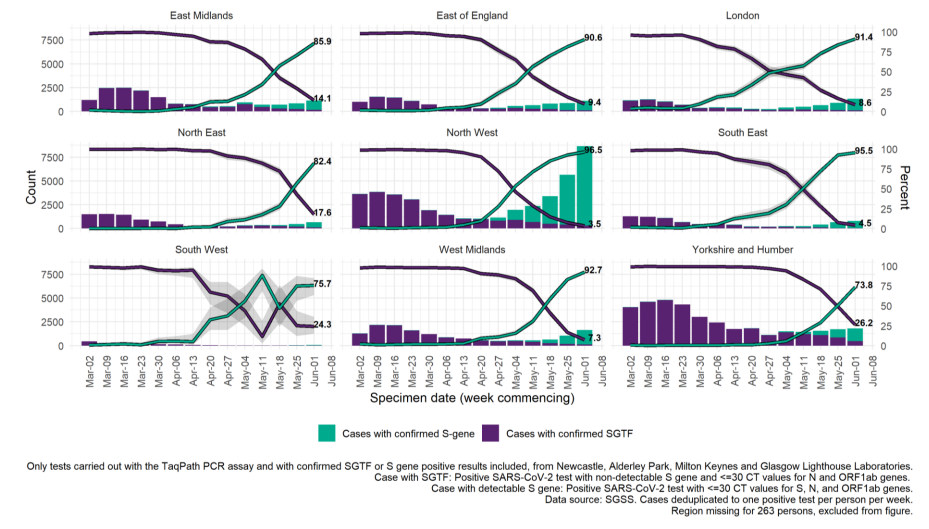
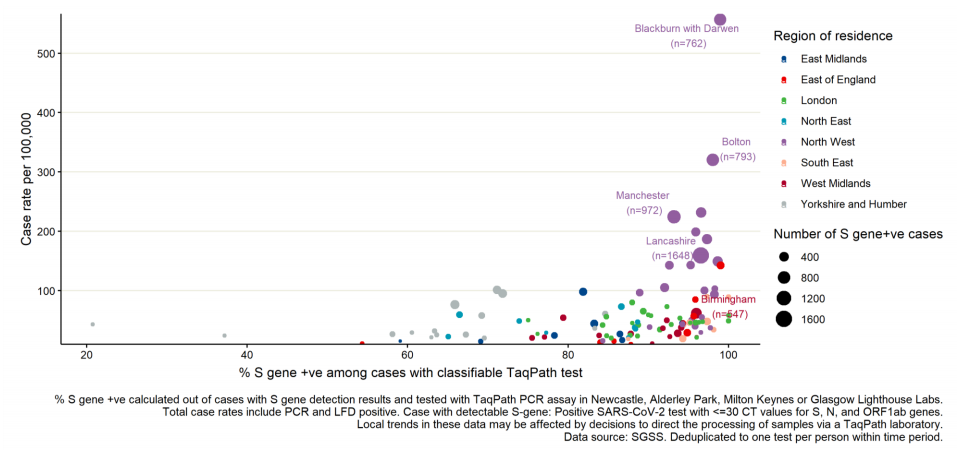
Figure 22. 7-day COVID-19 case rates per 100,000 population vs proportion S gene positive cases among those tested with TaqPath assay, by upper tier local authority (UTLA) of residence.2021, data as of 8 June 2021 (3 most recent days excluded due to reporting delay). Restricted to UTLAs with >20 cases tested on TaqPath assay. Five UTLAs with highest number of S gene positive cases labelled. (Find accessible data used in this graph in underlying data).
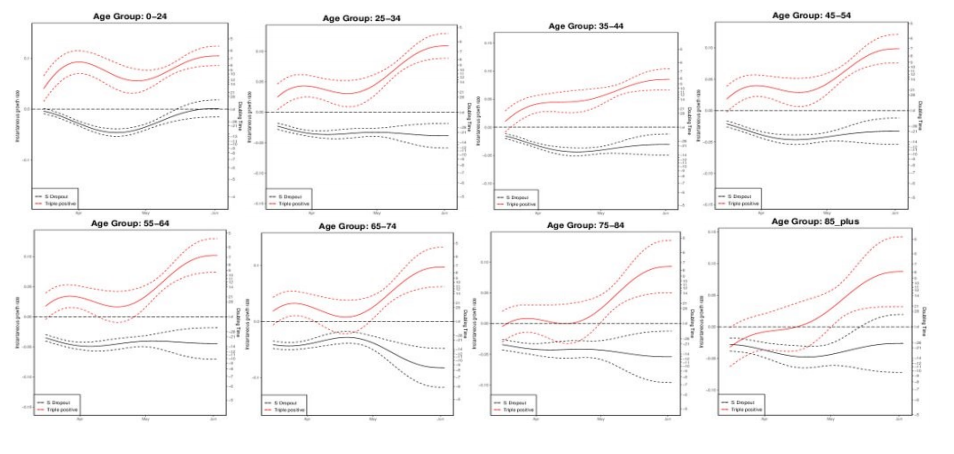
Growth rate of S gene positive and negative cases1
Figures 23 to 25 show growth rate and doubling time of S gene positive (all 3 PCR targets
positive) and negative (S gene target failure), produced by fitting a generalized additive
model with a quasi-Poisson.
The left vertical axis in both figures describe the daily growth rates; and the right vertical
axis the corresponding daily doubling times, that is number of days required for cases to
double at that particular growth rate. The dashed lines represent uncertainty (95% CI),
which grows when the number of data points used for the estimation is smaller. Note that,
if an epidemic trend changes from growth to decline, the growth rates change from
positive to negative, while the doubling times become longer and longer, cross infinity
when the trend is temporarily flat, and turn into halving times (that is number of days it
takes for cases to halve), represented as negative doubling times.
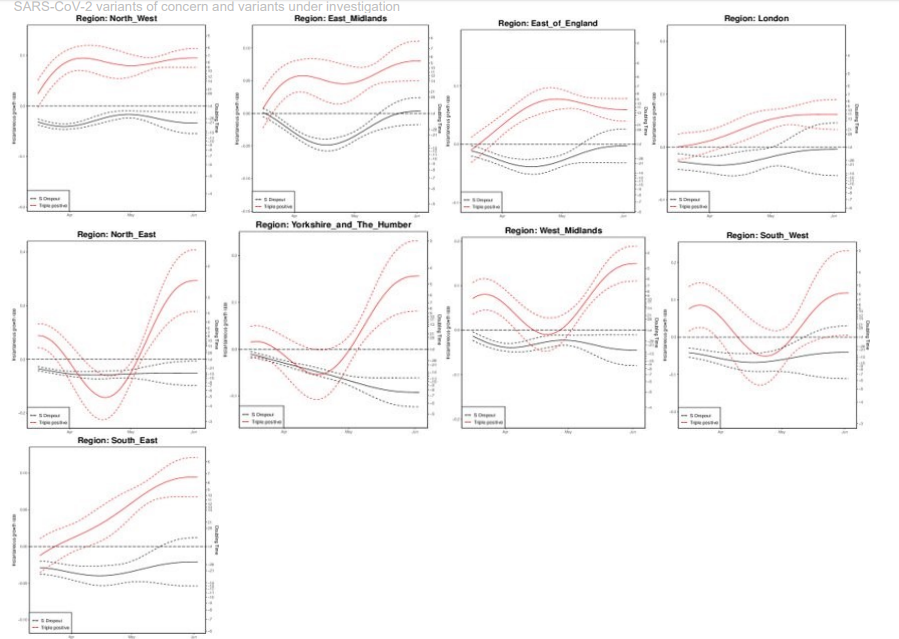
Figure 24. Growth rate and doubling time of S gene positive and negative cases by ethnicity as of 4 June 2021.The growth rate for cases with all 3 PCR targets positive has been increasing over the course of April and May in most ethnicities. Doubling times are around a week, lowest in White ethnicity at around 5 days, longer in Indian ethnicity, at around 3 weeks). Confidence intervals are wide, and data on PCR targets is low in some regions. (Find accessible data used in this graph in underlying data).
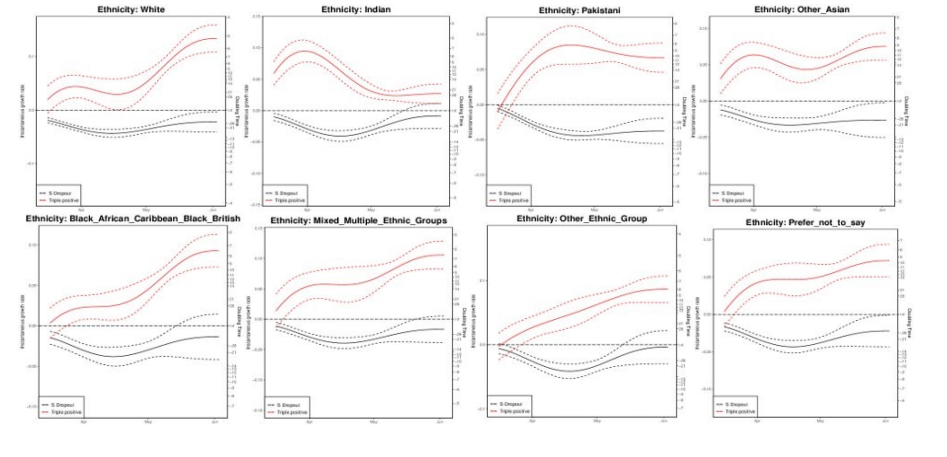
Figure 25. Growth rate and doubling time of S gene positive and negative cases by age as of 4 June 2021.There is a doubling time of S-gene positive cases of around a week across age groups (all ages doubling time 7 days (5.5 - 8.5)), whilst cases with S dropout are in decline in almost all age groups. Confidence intervals are wide, and data on PCR targets is low in some regions. (Find accessible data used in this graph in underlying data).
Delta-AY.1 (Delta with K417N).
Through routine scanning of variation in Delta a small number of sequences were
detected which had acquired the spike protein mutation K417N.
Information suggests that there are at least 2 separate clades of Delta with K417N. One
clade is large and internationally distributed with PANGO lineage designation AY.1. A
second clade found in sequences uploaded to GISAID from the USA. There is limited
epidemiological information available at present.
International Epidemiology
As of 7 June 2021, 63 genomes of Delta with K417N have been identified on GISAID.
from Canada (1) Germany (1), Russia (1), Nepal (2), Switzerland (4), India (6), Poland (9),
Portugal (12), Japan (13), USA (14).
Epidemiology
There are currently 36 cases of Delta-AY.1 in England (35 confirmed sequencing and 1
probable genotyping) plus an additional 10 sequences which include some cases in other
UK nations and some genomes for which case data is being sought. The first 5 cases
were sequenced on 26 April 2021 and were contacts of individuals who had travelled from,
or transited through, Nepal and Turkey. All these cases were detected in the West
Midlands. Cases have been detected in 6 different regions in England (Table 21, Figure
26). The majority of cases are in younger individuals, with 2 cases of age 60 or over
(Figure 27). Out of the 36 cases, there were 11 travel associated cases (6 travellers and 5
cases amongst contacts of travellers). Twelve cases have no history of travel or contact
with travellers. Countries of travel, which may include direct travel from or transit through,
include India, Malaysia, Nepal, Singapore and Turkey.
Of the 36 cases, 27 cases were known to have a vaccination status within the National
Immunisation Management System (NIMS), when linked on NHS number. Of these, 18
cases occurred in people who were not vaccinated, 2 cases in people who had received
their first dose within 21 days of specimen date, 5 cases in people who had received their
first dose more than 21 days after specimen date. There was a total of 2 cases where
there were more than 14 days between the second dose of vaccine and a positive
specimen. No deaths have been recorded amongst the 36 cases.
Delta with K417N can be detected by genotyping assay, which means that rapid case
identification and response activities can be undertaken. Health Protection Teams respond
with high priority to case finding and control measures for cases of Delta-AY.1.
| PHE regions | Number of cases |
| East Midlands | 1 |
| East of England | 0 |
| London | 3 [1] |
| North East | 0 |
| North West | 3 |
| South East | 15 |
| South West | 2 |
| West Midlands | 10 |
| Yorkshire and Humber | 0 |
| Unknown | 1 |
| Total | 36 |
Figure 26. Delta-AY.1 cases (confirmed and probable) by region of residence and specimen date as of 9 June 2021. Probable case is denoted by *. Larger plot includes last 60 days only. (Find accessible data used in this graph in underlying data).
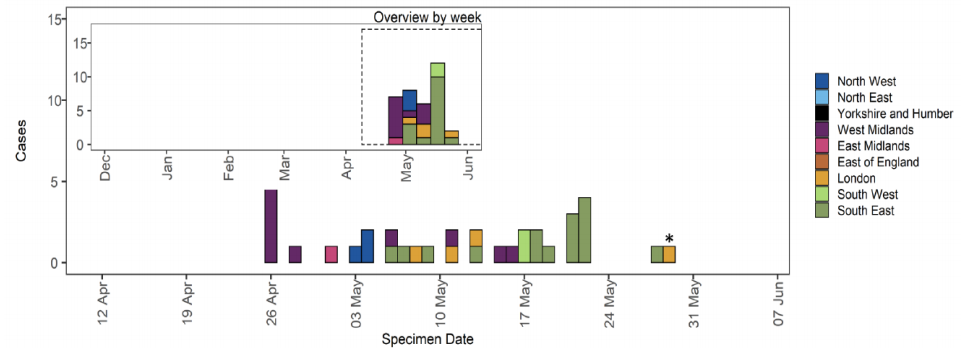
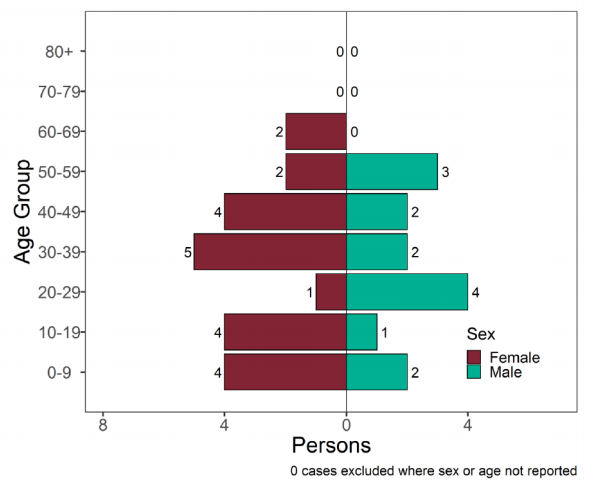
Figure 27. Age-sex pyramid of Delta-AY.1 cases (confirmed and probable) as of 9 June 2021. (Find accessible data used in this graph in underlying data.).
Sources and acknowledgments
Data sources
Data used in this investigation is derived from the COG-UK dataset, the PHE Second
Generation Surveillance System (SGSS), NHS Test and Trace, the Secondary Uses
Service (SUS) dataset and Emergency Care Data Set (ECDS).
Variant Technical Group
Authors of this report
PHE Genomics Cell
PHE Outbreak Surveillance Team
PHE Epidemiology Cell
PHE Contact Tracing Data Cell
Variant Technical Group Membership
The PHE Variant Technical Group includes representation from the following
organisations: PHE, DHSC, BEIS, Public Health Wales , Public Health Scotland, Public
Health Agency Northern Ireland, Imperial College London, London School of Hygiene and
Tropical Medicine, University of Birmingham, University of Cambridge, University of
Edinburgh, University of Liverpool, the Wellcome Sanger Institute.
Acknowledgements
The authors are grateful to those teams and groups providing data for this analysis
including: the Lighthouse Laboratories, COG-UK, the Wellcome Sanger Institute, tthe PHE
Epidemiology Cell, Contact Tracing, Genomics and Outbreak Surveillance Teams.
Published: May 2021
PHE gateway number: GW-8226